2019: Volume 2, Issue 2
Past Issues
 Abstract
  PDF
PDF Supplement
Single Subject Studies in Prostate Cancer: How graphing PSA test results and testosterone levels using Process Behavior and Celeration Charts can provide insight and guide clinical decisions
Al Pfadt*1, Donald J Wheeler2
1Former Research Scientist at the New York State Institute for Basic Research in Developmental Disabilities, New York, USA 2Fellow American Statistical Association, Consulting Statistician, SPC Press, Tennessee, USA
*Corresponding Author: Albert Pfadt, Former Research Scientist at the New York State Institute for Basic Research in Developmental Disabilities, New York, USA
Received: February 21, 2019 Published: March 14, 2019
ABSTRACT
Process Behavior Charts and Celeration Charts provide effective ways to visualize the clinical status of a patient with prostate cancer and to evaluate the effectiveness of treatments. Process Behavior Charts allow a definitive answer to the question of whether a change has occurred in spite of the variability of the PSA values, and when changes are occurring the Celeration Chart provides an easy estimate of the rate of growth. Both of these graphic techniques help in the overall understanding of the status of a patient at risk for prostate cancer by placing current PSA values in the context of the history of that patient.
Keywords: PSA test results, Testosterone levels, Process Behavior Charts and Celeration Charts, Prostate Cancer, Single Subject Studies
INTRODUCTION
Precision medicine and personalized oncology have emerged as patient-centered approaches to care that address the question of which treatment is the best alternative for a particular patient with prostate cancer. Such single-subject studies have a different objective than classical clinical research studies, and they require a different type of analysis. Rather than trying to determine if, on the average, a treatment is effective for a whole class of subjects, a single-subject study seeks to determine what works for a particular patient at various points in time. This emphasis upon the progress over time requires that we consider the temporal order of the data when evaluating the effects of various treatments. This paper combines two standard graphic presentation techniques to answer the two key questions in the treatment of prostate cancer. We use a Process Behavior Chart to answer the question: “Has a change occurred?” And when changes are detected, we use a Celeration Chart to answer the question: “What is the rate of change?”
Background
The Process Behavior Chart (aka a control chart) is a proven data analysis technique that works by providing feedback that allows the user to separate signals of a change from the routine background variation of the system being studied. By filtering out the routine variation which is inherent in the data, a Process Behavior Chart allows the user to detect unintentional changes when they occur and to evaluate the effectiveness of deliberate changes in therapies.
When Dr. Walter Shewhart created the Process Behavior Chart he noted that it had an “intriguing generality” [1]. Wheeler exploited this generality to extend Shewhart’s work to managerial applications [2]. Pfadt and Wheeler illustrated how Process Behavior Charts can be applied to make data-based clinical decisions that improve outcomes in healthcare settings [3, 4, 5]. Boggs and Wheeler, et. al., showed how process behavior charts could be used to improve the outcomes in the long-term treatment of asthma [6, 7, 8]. Diaz and Neuhauser [9] re-analyzed two archival data sets and came to the provocative conclusion that Process Behavior Charts are sometimes superior to the use of randomized clinical trials to detect specific treatment effects.
In 2007 Tennant, Mohammed, Coleman, and Martin [10] conducted a systematic literature review that identified 74 relevant abstracts describing the use of process behavior charts in clinical settings. Seven of these studies met their inclusion criteria of monitoring variation in clinically relevant variables at the level of an individual patient. They concluded that: “Control charts appear to have a promising but under-researched role in monitoring clinical variables in individual patients.” Thus, the use of a Process Behavior Chart in a single subject study is an established technique with a proven track record.
When the Process Behavior Chart shows evidence of a change, or when clinical evidence of cancer exists, we can then turn to a technique known as “Celeration Charting” developed by Dr. Ogden Lindsley and his colleagues to characterize the rate of change [11, 12]. We will illustrate how both of these techniques can be used in tandem, thereby facilitating a finer-grained analysis of clinical data than is provided by either approach used separately.
The Guidelines for Interpreting PSA Results
The general consensus is that elevated PSA levels per se cannot be used to diagnose the presence of cancer. However, once a patient’s prostate cancer begins to grow actively, changes in its rate of PSA production can serve as a fairly reliable surrogate measure indicating how rapidly the cancer is spreading [13. 14, 15]. This is determined by calculating the time needed for the PSA level to double, a value known as the PSA doubling time (PSA-DT). While the authors above consider PSA-DT to be a reliable measure of disease progression, the multiplicity of computational methods often leads to appreciable differences in the end result [16]. The method proposed here avoids both the confusion of the various computational algorithms and the question of how many data to use. It lets the patient or physician listen to the voice of the process and use as many data as appear to be appropriate at each critical juncture during the patient’s treatment. In other words, we let the “PSA kinetics” associated with each person’s prostate cancer provide an indicator of the tumor’s activity at various points in time.
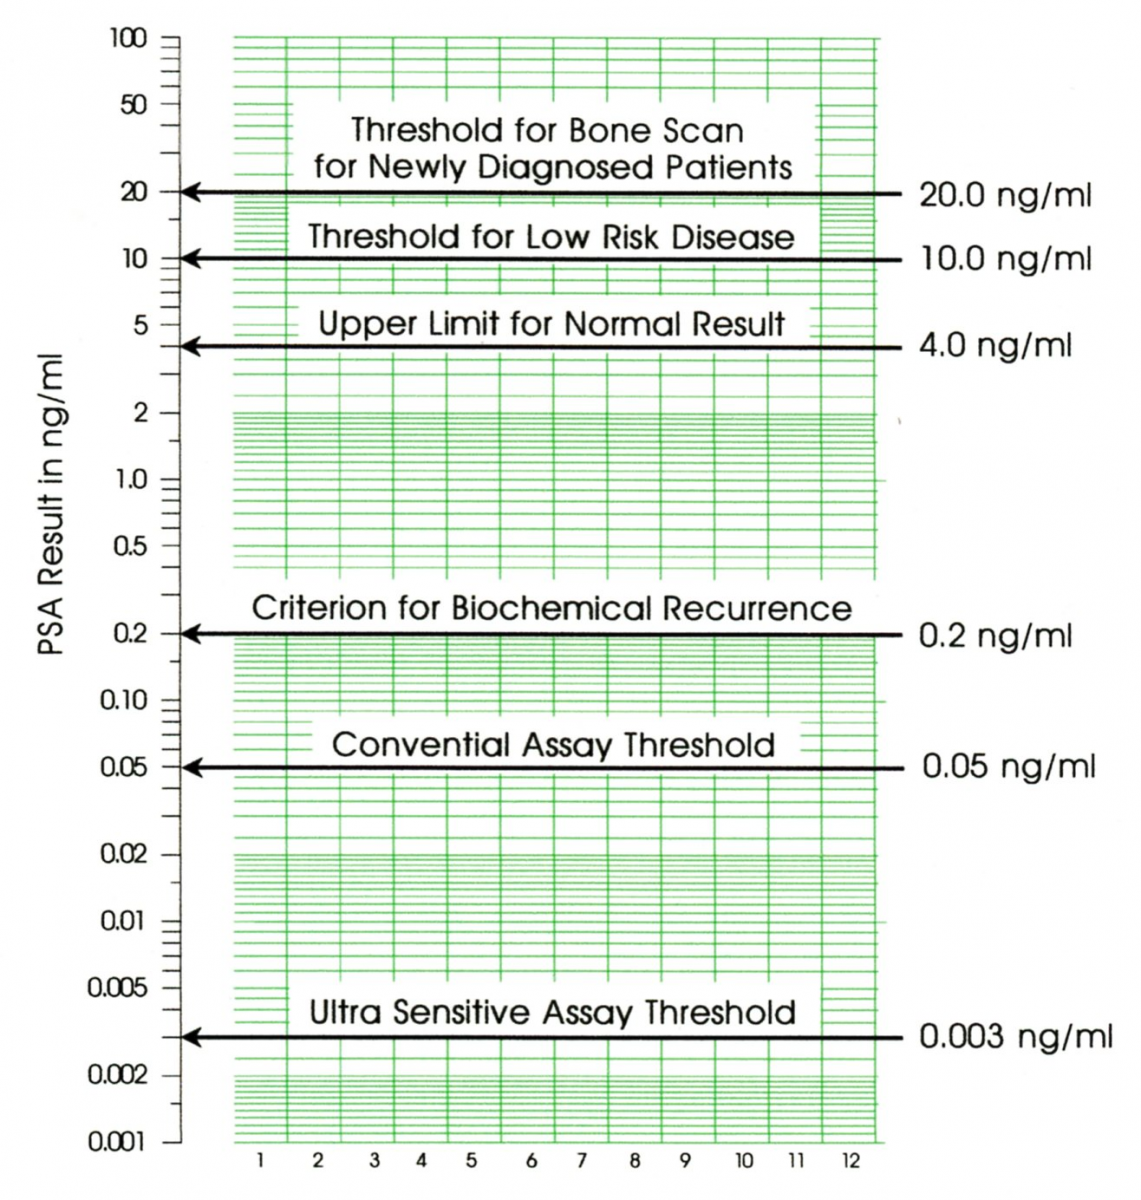
Figure1: Guidelines for Interpreting PSA Test Results
The American Urology Association has issued guidelines for using PSA test results for the pretreatment staging and the post treatment management of prostate cancer [17]. Some of these guidelines are illustrated in Figure 1. Yet these guidelines do not answer the question of interest that occurs every time a new PSA value is obtained. That question is “Has a change occurred?" To answer that question we have to learn how to use a Process Behavior Chart.
Process Behavior Charts
PSA values, like all measurements in this world, are subject to the effects of variation. Shewhart’s great insight was that this variation comes in two flavors. There is the routine, run-of-the-mill variation that is always present in every data stream, and then there is the exceptional variation that only shows up when the underlying process has changed in some fundamental manner. And to separate the routine variation from the exceptional variation, Dr. Shewhart created the Process Behavior Chart.
The simplest type of Process Behavior Chart is a chart for individual values, also known as an X-chart, or an I-chart. A Process Behavior Chart is a sequential procedure that uses a baseline period to define the voice of the process, and then compares each future value against that baseline. As long as the future values fall within the baseline limits we consider the process to be operating in the same way as it operated during the baseline period. Whenever a future value falls outside the baseline limits it is interpreted as a signal that a change has occurred in the underlying process. The point of computing the baseline limits is to use them in evaluating future values.
In the absence of a reasonable, data-based filter to separate the routine variation from the potential signals of a change, two mistakes of interpretation are possible. The first mistake is to get a false alarm (by interpreting the routine variation of an unchanging process as if it amounted to a signal of a change). The second mistake is to miss a real signal (by thinking that the variation of a changing process is nothing but routine variation). The Process Behavior Chart strikes a balance between these two mistakes by filtering out virtually all of the routine variation so that any points outside the limits are almost certainly signals of a process change [18].
Finding a Signal Among the Noise
To illustrate a Process Behavior Chart we begin with the data from a 28-day experiment. These data were published by a prostate cancer patient (TH) on the web site “You Are Not Alone” (YANA). They are often cited as an example of how much variation is present in PSA values even when all reasonable attempts have been taken to control extraneous variables. In order to minimize day-to-day variability, blood samples were taken at the same time each day and were analyzed by the same lab. TH adhered to the same diet and followed the same exercise routines throughout this 28-day period. A more detailed description of TH’s experiment may be found by entering the descriptor “28-day experiment” on the YANA web site.
In this example, where we have an abundance of data obtained within a short period of time, we use a baseline of 14 points to define the voice of the process. We compute the Average for the first 14 PSA values and get 4.93 ng/ml. Next we find the 13 differences between these 14 successive values and compute their average to get 0.18 ng/ml. This average of the successive differences is known as the Average Moving Range. The Average Moving Range of 0.18 ng/ml is multiplied by the scaling factor of 2.66 to get 0.47 ng/ml as the “three-sigma” distance. The upper natural process limit is found by adding this three-sigma distance to the Average of 4.93 ng/ml to get 5.40 ng/ml. The lower natural process limit is found by subtracting the three-sigma distance from the Average to get 4.46 ng/ml. Thus we get the Process Behavior Chart in Figure 2.
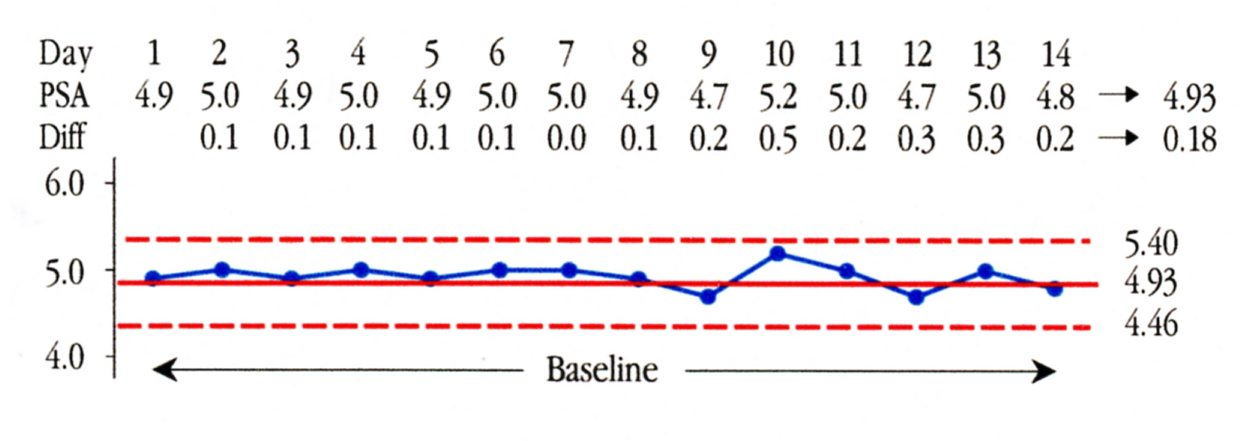
Figure 2: Baseline for the 28 Day Experiment
This baseline chart tells us that TH’s routine variation should result in PSA values between 4.5 ng/ml and 5.4 ng/ml. Yet over the course of the next two weeks TH’s PSA values ranged from 4.6 ng/ml to 6.0 ng/ml.
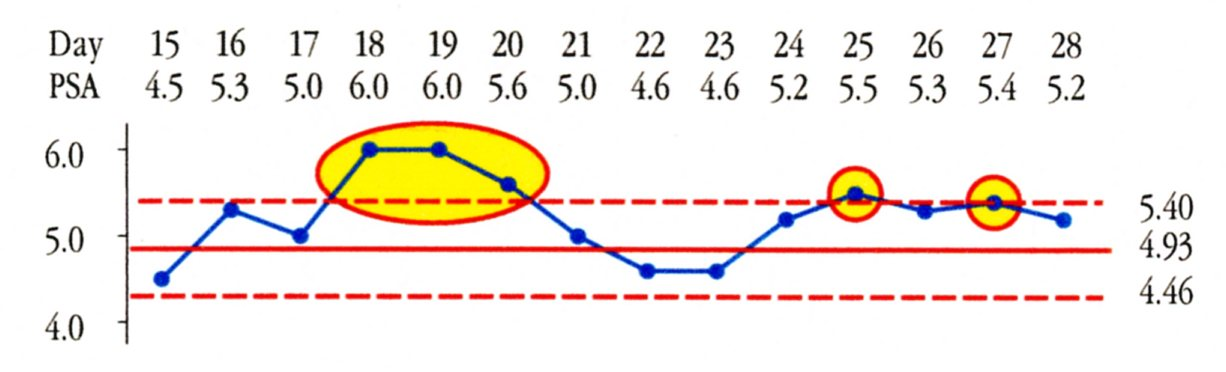
Figure 3: Weeks Three and Four of the 28 Day Experiment
In Figure 3 we find Days 18, 19, 20, 25, and 27 at or above the upper limit. These days are different from the baseline period and taken together they represent a shift that could have begun as early as Day 16. The average for Days 16 through 28 is 5.28 ng/ml. While this shift of 0.35 ng/ml may not call for any change in treatment, we know that TH’s PSA level increased during this 28 day experiment.
So while these 28 data have been interpreted as representing a stable period where all of the variation in the PSA readings is due to measurement error, we find a different story when we use a Process Behavior Chart. The chart does not tell us what happened, but it does identify the third and fourth weeks as being detectably different from weeks one and two. Therefore, interpreting all of the variation in these 28 test results as being due to routine variation is an example of missing a signal, which is the second of the two possible mistakes of interpretation. This has important implications for men with non-aggressive forms of prostate cancer who have decided to delay treatment until there is clear evidence that their PSA is progressing.
A Single Subject Study
In this and the following sections we describe the work of the senior author in collaboration with his treatment team. In practice PSA values are often obtained on an annual or semi-annual basis. As a result we may end up creating baselines with as few as three or four values. In AP’s case we begin with the three values shown in Figure 4. These values were obtained as part of routine physical examinations and were all analyzed by the same lab. The Average PSA value is 3.00 ng/ml, and the Average Moving Range is 0.17 ng/ml. When we multiply the average moving range by the scaling factor of 2.66 we get a three-sigma distance of 0.45 ng/ml. Adding and subtracting this value to the average of 3.00 gives the baseline limits of 2.55 ng/ml to 3.45 ng/ml shown in Figure 4.
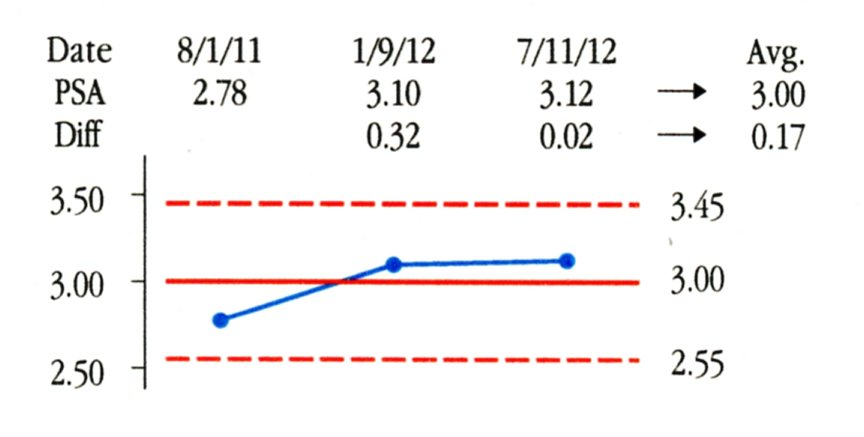
Figure 4: Baseline for AP’s Process Behavior Chart
The limits found in Figure 4 characterize the PSA values for AP in 2011 and 2012. Now the question is whether future values are consistent with this baseline. On Jan. 14, 2013 AP’s next PSA test result was 3.75 ng/ml. We add it to the Process Behavior Chart in Figure 5. Since this value falls above the upper limit of 3.45, we can interpret this value as a signal that a change has occurred. This test result for AP is elevated relative to his personal baseline. Why the change occurred may not be clear, but the fact that this most recent value is elevated relative to AP’s baseline of 2011 and 2012 is evidence that justifies further investigation. Rather than treating the 3.75 value as merely routine variation, Figure 5 shows that it is a potential signal and deserves to be treated as such.
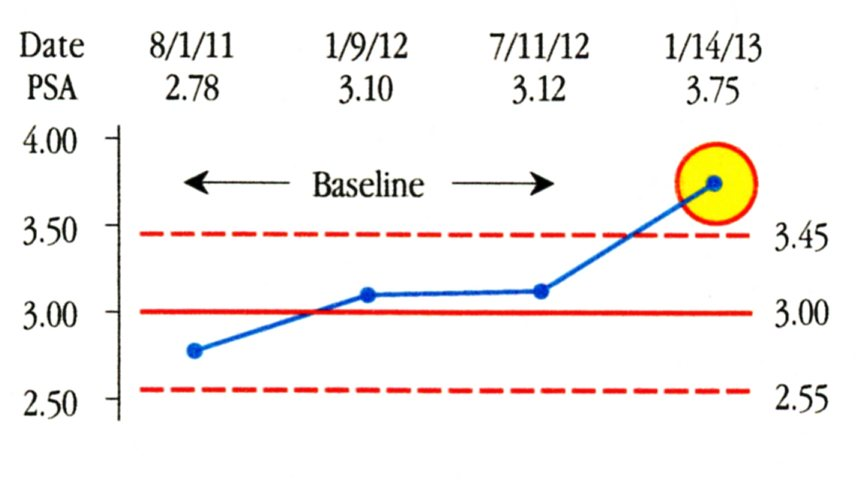
Figure 5: AP’s Process Behavior Chart in 2013
However, since the test result of 3.75 ng/ml was below the guideline value of 4 ng/ml (see Figure 1), another PSA test was not done until almost 18 months later. By then, although AP was not symptomatic at that time, clinical signs of cancer were present as per the results of a digital rectal examination and imaging studies.
The Celeration Chart
When a change has been detected in PSA levels the question of interest changes from “Has a change occurred?” to “How fast are the PSA values changing?” To answer this new question it is useful to plot the PSA values on a Celeration Chart. This chart differs from a Process Behavior Chart in two ways. While the vertical scale of a Process Behavior Chart may be either linear or logarithmic, the vertical scale of a Celeration Chart is always logarithmic. By using a logarithmic scale we turn exponential growth curves into straight lines, which are easier to draw and use. The second difference is in the horizontal scale. While the Process Behavior Chart only cares about the time order sequence for the PSA values, a Celeration Chart places the specific dates of each PSA test on the horizontal time scale in order to provide the basis for calculating the rate of change (the doubling time).
The first 4 data points in Figure 6 are taken from Figure 5. On May 9, 2014, AP had a PSA test value of 8.08. On June 2 a repeat test gave a PSA value of 9.98. Not only do these two values confirm the value of 3.75 as a signal of increasing PSA, but they also give us a way to estimate the doubling time for the PSA values. Connecting the value of 3.75 with the mid-point of the line connecting 8.08 and 9.98 values we get a celeration line as shown in Figure 6.
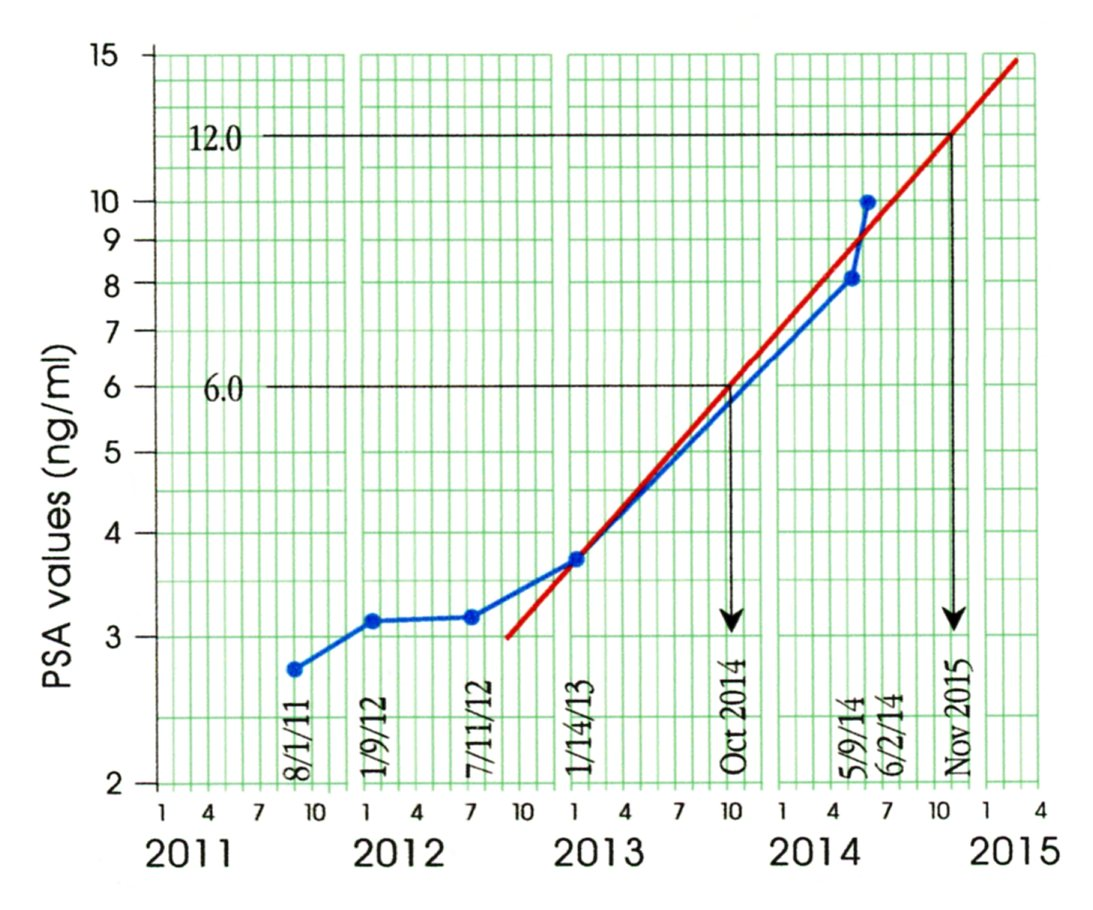
Figure 6: AP’s Celeration Chart through June 2014
We estimate the PSA doubling time from the celeration line as follows: Pick any PSA value (such as the value of 6.0 shown) and its double (12.0) and find the dates associated with these two values using the celeration line (October 2014 and November 2015). The time difference between these two dates will be an estimate of the doubling time. (Here we estimate a 13-month doubling time.) Thus, when a change is occurring, the Celeration Chart provides an easy way both to visualize the change and to estimate doubling times. In the following section we will illustrate the role of a Celeration Chart in a prospective, single-subject clinical trial.
PSA doubling time estimates are typically based on three or four values. Given the variability in PSA values, these estimates of doubling times will always be inherently uncertain. While some find this uncertainty troubling, it will always be present. This is true regardless of whether the estimates come from some computerized algorithm or from a line eyeballed on a graph. At least with the Celeration Chart you can see if the celeration line provides a reasonable fit to the data. The utility of PSA doubling times is great enough that their uncertainties are not an obstacle in practice. Tisman [15] attempted to compute specific growth rates as an alternative to doubling times, but these rates show even more inherent uncertainty than do the doubling times.
Conducting a Prospective Clinical Trial
With a doubling time of approximately 13 months, and given the other clinical indicators, it was decided that AP was a candidate for the definitive treatment for prostate cancer, a Prostatectomy. This surgery took place in August of 2014. Since PSA is also produced in small amounts by other glands in the body [19], a prostatectomy is not expected to completely eliminate PSA in the blood. At six weeks and three months post- surgery AP had PSA levels of 0.58 ng/ml and 0.88 ng/ml. The surgeon considered these levels to be inconclusive evidence as to the success of the surgery. He cautioned that it would require a third PSA test to determine if the results represented an exponential growth pattern characteristic of the spread of prostate cancer. Six months after the surgery AP had a PSA level of 1.46 ng/ml. As may be seen on the Celeration Chart in Figure 7, AP’s post-surgery PSA levels show a doubling time of about 3.5 months.
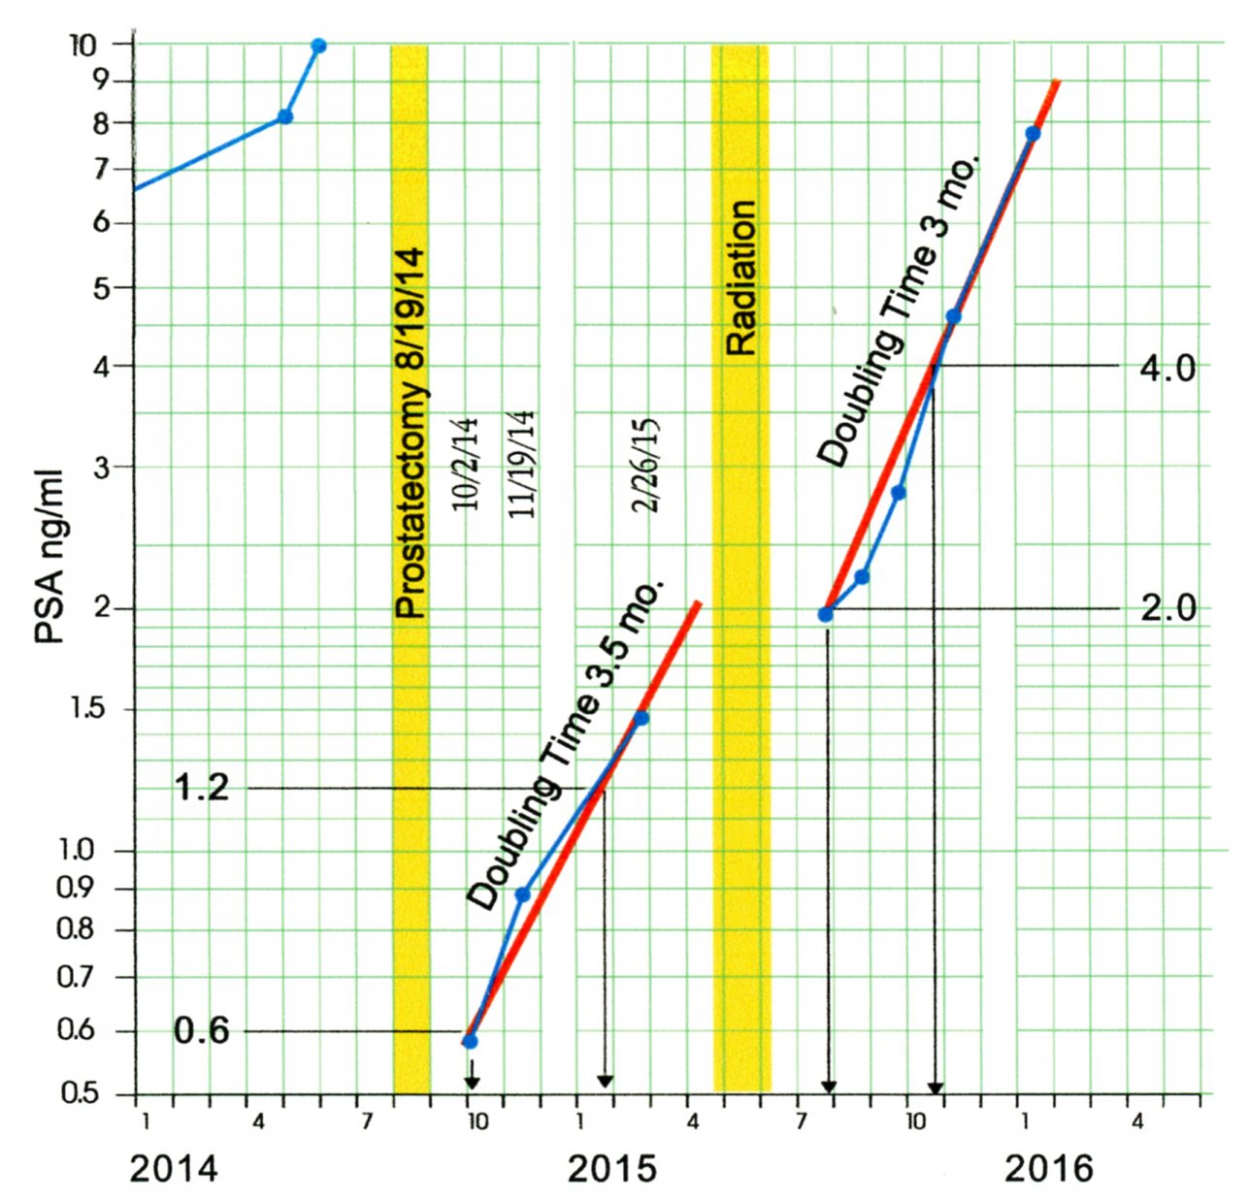
Figure 7: Post Surgery and Post Radiation Celeration Chart
So, not only was the surgery not successful in reducing PSA to the target zone of less than 0.02, but the increased doubling time suggested an increase in tumor growth rate. Therefore, for a six-week period between late April and early June 2015, AP underwent a series of “salvage radiation” treatments.
AP’s July PSA value of 1.96 ng/ml was initially interpreted as the result of irritation from the radiation. However, subsequent values suggest that it was due to the continued growth of the prostate cancer. In the following months AP’s PSA levels continued to increase, with a doubling time of about three months. While the radiation treatment delayed the progression of PSA levels by about 3.5 months, the prostate cancer was actively growing at the end of 2015.
Following the failure of surgery and radiation to stop the progression of prostate cancer, the typically recommended treatment is Androgen Deprivation Therapy (ADT) [20]. ADT is based on the finding that, except for rare cases, the prostate cancer that survives surgery and radiation treatments is dependent upon androgens [mainly in the form of testosterone] for its ability to grow and proliferate. ADT works by either suppressing the level of testosterone in the blood or by interfering with the activity of the androgen receptors in prostate cancer cells to make use of any testosterone that is available. Since testosterone serves many vital biological functions the suppression approach is associated with many negative side effects.
In an effort to avoid, or at least delay the use of ADT, AP chose to begin a trial with medical marijuana in January of 2016. The protocol is described in AP’s page at the YANA web site. The success of this medical marijuana trial may be seen on the Celeration Chart in Figure 8. The four PSA test results obtained during the first phase of the trial in January, February and March 2016 show a plateau in PSA levels in the neighborhood of 7 and 8. (This represents the first plateau in AP’s post-surgery PSA levels.)
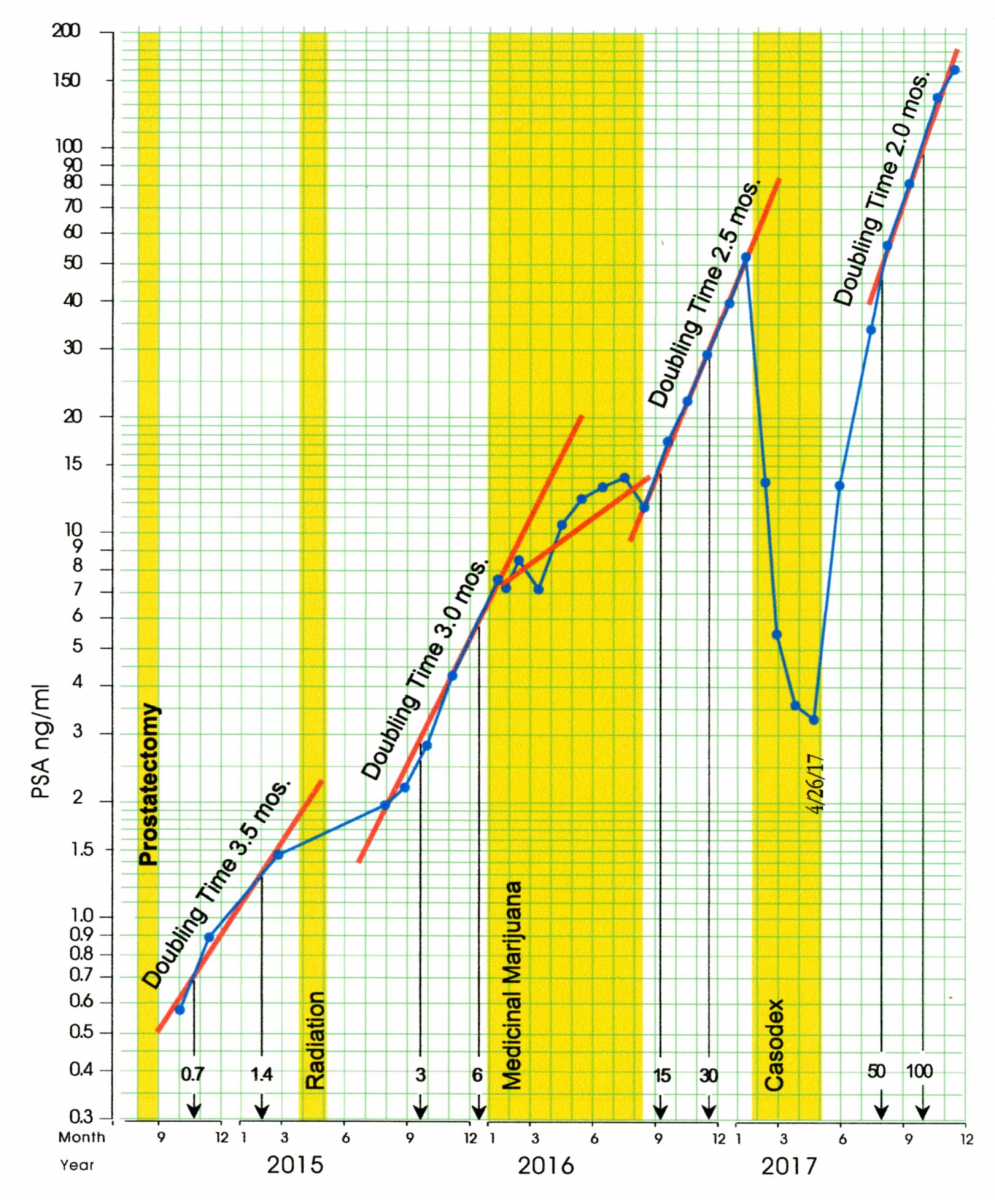
Figure 8: The Celeration Chart thru 2017
The second phase of this trial in April through August of 2016 involved changes in treatment to minimize the side effects of the medical marijuana. In this phase there was some growth in the PSA levels. Prior to the marijuana trial AP’s cancer had a doubling time of 3 months. During the two phases of this trial his PSA levels took about eight months to double from 7 to 14.
Following the medical marijuana trial the next five PSA tests show a doubling time of about 2.5 months, which is similar to the post-surgery and post-radiation doubling times. Overall, looking at the horizontal gap between the pre-marijuana progression slope and the post-marijuana progression slope in Figure 8, it would appear that the medical marijuana trial shifted the progression of the PSA levels to the right by about five months.
By January of 2017 AP’s PSA level had gone up to 52 and it was time to consider some form of ADT. Casodex [Bicalutimide] was chosen. This treatment blocks the cancer cells from taking up testosterone, which inhibits the growth of the cancer. AP started this treatment in February 2017 at the maximal dose of 150 mg per day. In two months his PSA reached a nadir under 4 ng/ml, which was the first time in 17 months it had been this low. However, this effect showed signs of becoming less effective, and AP found the side effects to be intolerable. So in spite of the reversal in the progression of PSA values, Casodex treatment was stopped at the end of April.
Imaging studies did not detect any specific sites where AP’s cancer had metastasized that could be targeted with external beam radiation so he decided to take a holiday from active treatment and recuperate from the cumulative side effects of the four failed treatment regimes. Within three months of ending treatment with Casodex AP’s PSA had returned to where it had been six months earlier, and toward the end of 2017 it was progressing with a doubling time of about two months. The Casodex treatment had delayed the progression of PSA values by about six or seven months.
As shown in Figure 8, by the end of 2017 AP’s PSA level had climbed to 161 ng/ml. Since there were still were no metastatic sites that were large enough to irradiate, it was obvious that Androgen Deprivation Therapy could no longer be delayed. At this point treatment with Firmagon began. Firmagon [Degarelix] works by blocking the release of testosterone into the patient’s blood stream to the extent that the patient becomes chemically castrated (testosterone-levels below 15 ng/dl.) The intent is to prevent the prostate cancer cells from having any androgen to use for celluar growth.
As the Firmagon therapy began AP discovered that he was eligible for a trial with a new immunotherapy, Provenge [Sipuleucel-T] Since AP’s prostate cancer had progressed to the point that the overriding concern was one of showing that any treatment was working rather than trying to decipher which treatment was working. Accordingly, AP and his team decided to complete the Provenge protocol while continuing with the Firmagon injections. Provenge treatment involves extracting white blood cells from the patient’s immune system by a process called leukapheresis, and then injecting them back into the patient’s blood stream after they have been treated with a virus that educates his immune system to more effectively target and destroy prostate cancer cells. This is accomplished in three stages during a 6-week period.
Because Firmagon works through blocking testosterone, Figure 9 shows both the testosterone levels in ng/dl (using the scale on the right) and the PSA levels in ng/ml (using the scale on the left). The objective of androgen deprivation therapy is to reduce PSA levels down below the cut-off for biochemical recurrence of 0.2 ng/ml. While the Firmagon injections dropped the testosterone-levels down below 15 ng/dl as intended, the PSA values plateaued around 5 ng/ml. Thus, Firmagon was not having the desired effect upon the PSA levels.
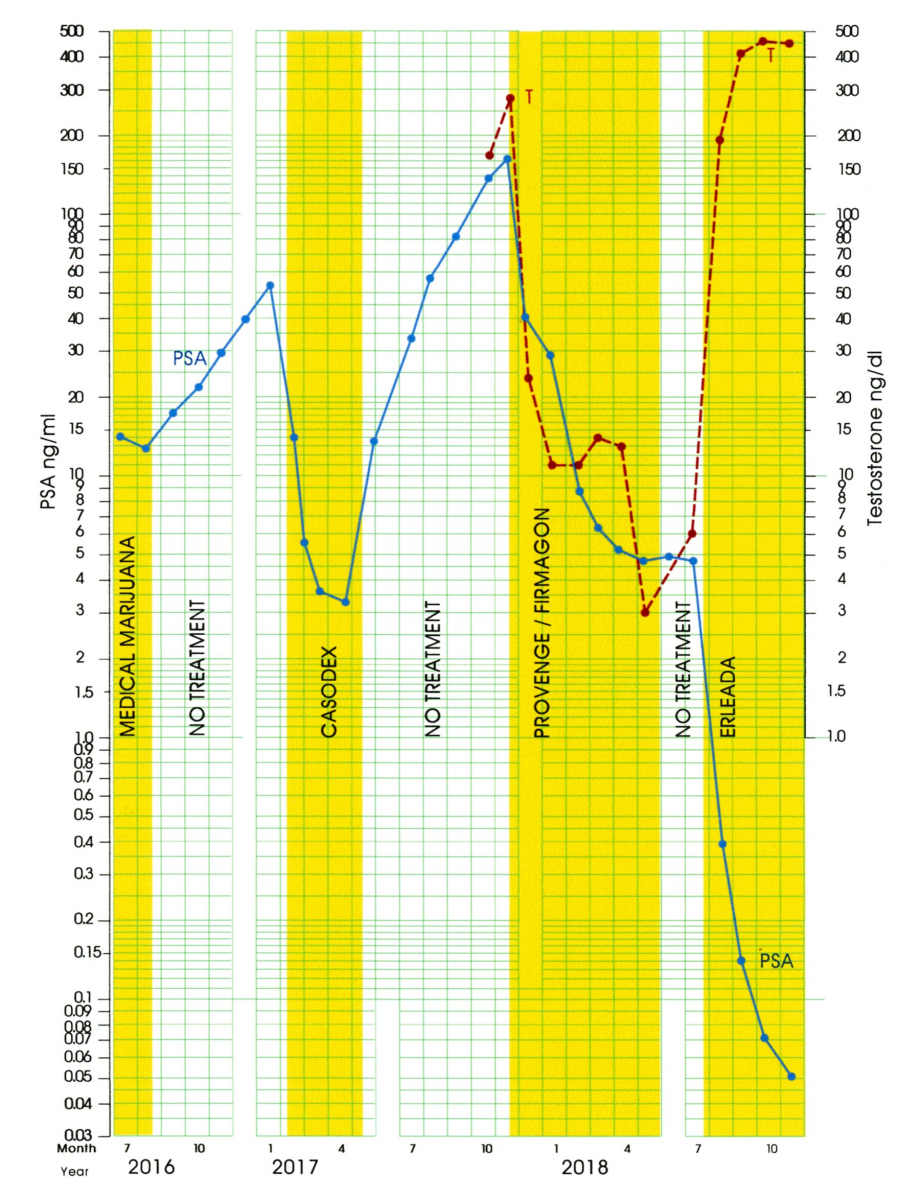
Figure 9: Celeration Chart for PSA and Testosterone levels
Although AP’s cancer did not yet officially meet the criteria for being considered to be “castrate resistant” (where the PSA levels are increasing in spite of very low T levels), it was clearly headed in that direction. After six months of Firmagon injections AP’s PSA levels remained at 4.5 to 5.0 ng/ml. A change in his treatment protocol was needed.
Erleada [Apalutimide] is a new medication approved for the treatment of prostate cancer that has become resistant to the effects of medications like Firmagon. Like Casodex, Erleada blocks the ability of testosterone to bind to the androgen receptor. It had previously been used in conjunction with a testosterone suppressing medication like Firmagon. However, based on the effectiveness already seen with Casodex, AP and his oncologist managed to get approval for using Erleada as a monotherapy.
Although it is not possible to make generalizations based on only four data points, the results after four months of treatment with Erleada alone are truly dramatic. AP’s last three PSA levels all fell below the 0.2 ng/ml level used as a guideline for a successful treatment. In addition, the jump in AP’s T-levels to twice his pretreatment test results was unanticipated and resulted in an improved quality of life, as well as less deleterious side effects.
One potential criticism of interpreting the low PSA readings in Figure 9 as being the results of Erleada is that they could have been due to the confounding effect of Provenge. However, in clinical trials, Provenge has not been found to produce such a dramatic drop in PSA levels.
Another potential criticism is that the start of Erleada was not accompanied by a long enough period of no treatment to establish a new baseline against which to evaluate its effectiveness. Instead Erleada was started only two months after Firmagon was discontinued.
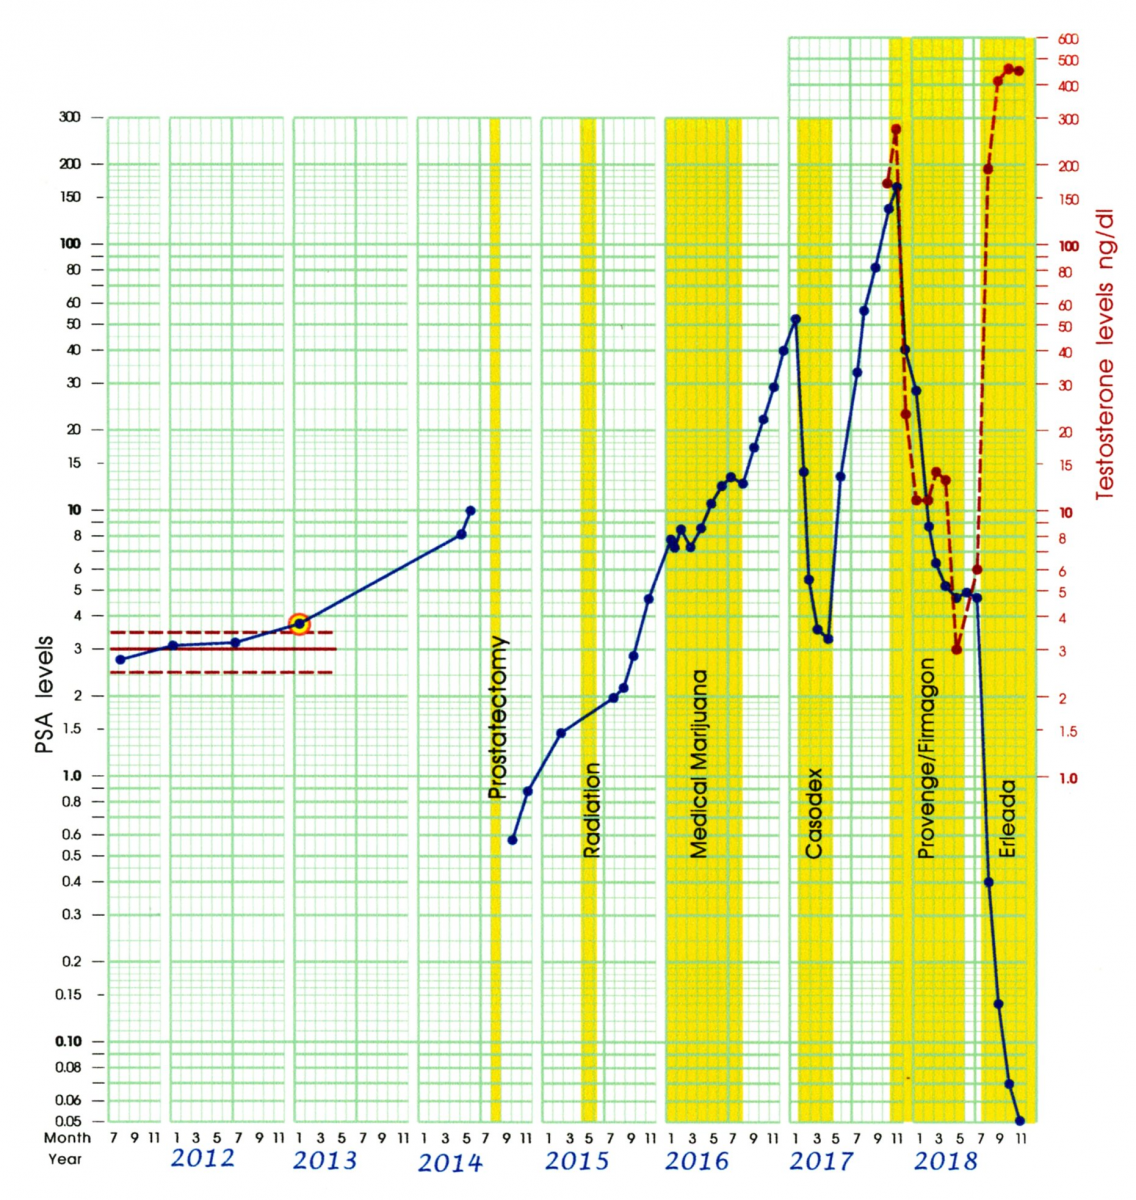
Figure 10: AP’s Celeration Chart for 2011 - 2018
However, it is possible to consider AP’s entire treatment history as providing a “retrospective baseline.” This type of single-subject study was first described by Houtler and Rosenberg [21] as an alternative to prospective baselines that delay the onset of effective treatment. Such retrospective designs have frequently been used in medical studies where treatment is preceded by a review of the patient’s chart to gather evidence that previous treatments have been ineffective. In this case we have contemporaneous evidence that 5 previous treatments have been ineffective, using evidence that had been analyzed extensively prior to the start of Erleada. Rather than lacking an appropriate baseline, AP’s treatment with Erleada can be considered to be an example where multiple baselines, obtained across different experimental conditions, were used to evaluate its effectiveness. Johnson and Pennypacker [22] provide numerous illustrations showing how such designs can be as effective in drawing valid conclusions about the effectiveness of a particular treatment.
It is too early to determine if it will be possible to maintain such low PSA levels together with normal testosterone levels. However, AP’s graphic record provides objective indicators that are specific to his treatment history and that can be used to answer that question. As we noted previously, when AP’s cancer is aggressively growing, it has had very short doubling times. A return to such a growth rate would clearly be a warning sign that treatment was no longer working, regardless of the absolute values of PSA test results.
However, as we saw in the data from the 28-day experiment, sometimes PSA values exhibit a slower but sustained growth pattern. If this proves to be the case with AP’s current status, a “trigger point” could be set for a decision to add an additional medication. For example, a decision might be delayed until PSA test results returned to a level of 5 ng/ml, where they plateaued when AP was taking Firmagon. It is important to emphasize that these criteria can and should be specified in advance, combining medical advice, the patient’s willingness to take risks, and the patient’s past treatment history. In this way a graph of the outcome data, such as the Celeration Chart, becomes a focal point for treatment planning, not something that is only used to evaluate earlier treatment decisions. This case study is a classic example of data-based clinical decision-making: using available data to generate ideas [a testable hypothesis], leading to treatment decisions, [an experiment], which is then evaluated by using the data gathered to determine the success or failure of the treatment.
Unfortunately, PSA levels cannot be solely used as a treatment guide since Bryce et. al. [23] report that about seven percent of the patients with castrate-resistant prostate cancer studied (65/872) showed no evidence of rising PSA levels even though radiological evidence of progression was present. However, as previously noted, PSA test results were never intended to replace more direct measures of tumor activity. There is some evidence that “liquid biopsies” which use blood samples from patients with metastatic prostate cancer to quantify the amount of circulating tumor cells that have detached themselves from the primary tumor [24,25] may provide an additional outcome measure which can be used together with PSA test results.
SUMMARY
By making allowance for routine variation a Process Behavior Chart allows us to definitively say if and when a change has occurred in PSA levels. This helps to avoid interpreting each small swing in the PSA values as a signal when it is just “noise.” At the same time, the Process Behavior Chart is sensitive to those early signals of growth that the various complex methods of computing doubling times cannot detect.
When we have definite indications that cancer is present and growing, the Celeration Chart allows us to characterize that rate of growth. Using the Celeration Chart alone you do not have the filtration provided by the Process Behavior Chart. However, due to the exponential growth that is characteristic of active prostate cancer, we prefer to use the Celeration Chart to view the whole progression of values that can often cover several orders of magnitude. Together the Process Behavior Chart and the Celeration Chart provide a complete package that is easy to implement and understand without resorting to complex algorithms and software programs. Each value can be plotted as a point, and the very act of plotting the points is itself an act of analysis. This enables clinical data to be used with the logic of the scientific method in single-subject studies. This in turn facilitates a collaborative relationship between patient and doctor that allows the patient to become part of the treatment team rather than merely being the object of treatment.
Additional Information Instructions for Using PSA Worksheets available to download at https://www.oncogen.org/PSA-Worksheets.pdf
REFERENCES
- Walter Shewhart (1939) Statistical Method from the Viewpoint of Quality Control. [1939 Ed], Dover Publications, Washington DC, USA, 149.
- Donald J Wheeler (1993) Understanding Variation, The Key To Managing Chaos. [2nd Ed] SPC Press, Tennessee, USA.
- A Pfadt, DJ Wheeler (1995) Using Statistical Process Control to Make Data-Based Clinical Decisions. J Appl Behav Anal 28(3): 349-370.
- A Pfadt, DJ Wheeler (2004) Using Data to Continuously Improve Treatment Outcomes: A Conceptual Framework and Practical Guidelines. The NADD Bulletin 7(5): 87-94
- A Pfadt, DJ Wheeler (2006) Applying a Continual Quality Improvement Model to Make Data-Based Clinical Decisions. Mental Health Aspects of Developmental Disabilities 9(2): 44-53
- Boggs PB, Wheeler D, Washburne WF, Hayati F (1998) Peak Expiratory Flow Rate Control Chart in Asthma Care: Chart Construction and Use in Asthma Care, Annals of Allergy, Asthma, and Immunology 81(6):552-562.
- Boggs PB, Hayati F, Washburne WF, Wheeler DA (1999) Using Statistical Process Control Charts for the Continual Improvement of Asthma Care. Jt Comm J Qual Improv 25(4): 163-81.
- Peter B Boggs, Fazel Hayati, Donald J Wheeler (1999) Drug Therapy using Statistical Process Control Charts to Guide Decision Making in Asthma Care. Drug Benefit Trends 42-52.
- M Diaz and D Neuhauser (2005) Pasteur and Parachutes: When statistical process control is better than a randomized controlled trial. Qual Saf Health Care, 14(2):140-143.
- Tennant R, Mohammed MA, Coleman JJ, Martin U (2007) Monitoring Patients using Control Charts: A systematic review. Ruth Tennant, Mohammed Mohammed, Jamie Coleman, and Una Martin. Int J Qual Health Care 19(4):187-194.
- HS Pennypacker, A Guitierrez, and OR Lindsley (2003) Handbook Of The Standard Celeration Chart, Cambridge Center for Behavioral Studies, Massachusetts, USA.
- Owen White and Malcolm Neely (2012) The Chart Book: An overview of standard celebration chart conventions and practices. https://education.uw.edu/sites/default/files/areas/edspe/white/readings/chartbook.pdf
- Kelloff GJ, Coffey DS, Chabner BA, Dicker AP, Guyton KZ, et al. (2004) Prostate-Specific Doubling Time as a Surrogate Marker for Evaluation of Oncologic Drugs to Treat Prostate Cancer. Clin Cancer Res 10(11): 3927-3933.
- Jeremy Teoh, Ming-Kwong Yiu (2016) Prostate Cancer - Leading edge Diagnostic Procedures and Treatments, The Role of Prostate-Specific Antigen (PSA) and PSA Kinetics in the Management of Advanced Prostate Cancer. IntechOpen, London, United Kingdom, 23-34
- Glenn Tisman (2013) Advances in Prostate Cancer, Describing prostate cancer dynamics: Second look at PSA-doubling time and PSA-specific growth rate, IntechOpen, London, United Kingdom, 178-216.
- Daskivich TJ, Regan MM, Oh WK (2006) Prostate Specific Antigen Doubling Time Calculation: Not as Easy as 1, 2, 4. J Urol 176(5): 1927-1937.
- PSA Testing for the Pretreatment Staging and Posttreatment Management of Prostate Cancer: 2013 Revision of 2009 Best Practice Statement.
- Donald J Wheeler, David S Chambers (2010) Understanding Statistical Process Control [3rd Ed], SPC Press, Tennesse, USA.
- Gabriella De Angelis, Harry Rittenhouse, Stephen Mikolajczyk, L Blair Shamel, Axel Semjonow (2007) Twenty Years of PSA: From prostate antigen to tumor marker. Rev Urol 9(3): 113-123.
- E David Crawford, Axel Heidenreich, Nathan Lawrentschuk, Bertrand Trombal, Antonio CL Pompeo, Arturo Mendoza-Valdes, et al. (2019) Androgen- targeted Therapy in Men with Prostate Cancer: Evolving practice and future considerations. Prostate Cancer Prostatic Dis 22(1): 24-38
- Houlter BD, Rosenberg H (1985) The Retrospective Baseline in Single-Case Experiments. The Behavior Therapist 8(5): 97-98.
- Johnston JM, Pennypacker HS (1993) Strategies and Tactics of Behavioral Research: [2nd Ed], Lawrence Erlbaum Associates, Inc, New Jersey, USA.
- Bryce AH, Alumkal JJ, Armstrong A, Higano CS, Iversen P, Sternberg CN, et al. (2017) Radiographic Progression with Nonrising PSA in Metastatic Castration-resistant Prostate Cancer; post hoc analysis of PREVAIL. Prostate Cancer Prostatic Dis 20(2): 221-227.
- Wicha MS, Liu S, Dontu G (2006) Cancer Stem Cells: An old idea- a paradigm shift. Cancer Res 66(4): 1883-90.
- Harris KS, Kerr BA (2017) Prostate Cancer Stem Cell Markers Drive Progression, Therapeutic Resistance,and Bone Metastasis. Stem Cells Int. 2017: 1-9.
Copyright: Pfadt A, et al. ©2019. This is an open-access article distributed under the terms of the Creative Commons Attribution License, which permits unrestricted use, distribution, and reproduction in any medium, provided the original author and source are credited.
Citation: Pfadt A (2019). Single Subject Studies in Prostate Cancer: How graphing PSA test results and testosterone levels using Process Behavior and Celeration Charts can provide insight and guide clinical decisions. Oncogen Journal 2(2): 10.