2020: Volume 3, Issue 1
Past Issues
 Abstract
  PDF
PDF Supplement
Conversion of Human Hepatoma Cells by 520d-5p to Benign or Normal Liver Tissues via a stemness-Mediated Process
Satoshi Tsuno1, Xinhui Wang1, Kohei Shomori2, Keigo Miura3, Yugo Miura3, Junichi Hasegawa1, Norimasa Miura1,3*
1Division of Pharmacotherapeutics, Department of Pathophysiological & Therapeutic Science, 86 Nishicho, Yonago, Tottori 683-8503, Japan 2Division of Organ Pathology, Tottori University, 86 Nishicho, Yonago, Tottori 683-8503, Japan 3PEZY-Pharma, Inc., 2-13-14 Hatagasaki, Yonago, Tottori 683-0845, Japan
*Correspondence author: Norimasa Miura, Division of Pharmacotherapeutics, Department of Pathophysiological & Therapeutic Science, 86 Nishicho, Yonago, Tottori 683-8503, Japan, E-mail: [email protected] Received: February 28, 2019 Published: September 17, 2020
ABSTRACT
The human ncRNA gene RGM249 regulates the extent of differentiation of cancer cells and the conversion of 293FT cells to hiPSCs. To identify the factors underlying this process, we investigated the effects of lentivirally inducing miR-520d expression in 293FT and HLF cells in vitro. Subsequently, we evaluated tumor formation in a xenograft model. Transformed HLF cells were Oct4 and Nanog positive within 24 h, showed p53 upregulation and hTERT downregulation, and mostly lost their migration abilities. After lentiviral infection, the cells were intraperitoneally injected into mice, resulting in benign teratomas (6%), the absence of tumors (87%) or differentiation into benign liver tissues (7%) at the injection site after one month. We are the first to demonstrate the loss of malignant properties in cancer cellsin vivothrough the expression of a single microRNA (miRNA). This miRNA successfully converted 293FT and hepatoma cells to hiPSC-like cells. The regulation of malignancy by miR-520dappears to be throughthe conversion of cancer cells to normal stem cells.
Keywords: Cancer, Stemness, miRNA, Differentiation, iPSC
INTRODUCTION
Mature microRNAs (miRNAs; single-stranded 20–23-nucleotide RNA molecules) control the expression of genes involved in many cellular processes [1]. miRNAs typically reduce the stability of mRNAs, including those encoding genes that mediate tumorigenic processes, such as apoptosis, cell cycle regulation, differentiation, inflammation, invasion and stress responses [2]. Mammalian miRNAs mediate cellular differentiation and reprogramming and play crucial roles in the initiation and progression of human cancers [3]. Alterations in miRNA expression can influence tumor growth by targeting and modulating the functional expression of genes that regulate tumor cell apoptosis or proliferation [4]. miRNAs can serve as tumor suppressors (suppressormiRs) and/or oncogenes (oncomiRs), and their expression has been found to be dysregulated in many malignancies [5]. miRNA targeting is primarily achieved through specific base-pair interactions between the 5’ ends (‘seed’ region) of miRNAs and target sites within the coding and/or untranslated regions (UTRs) of mRNAs; target sites in the 3’UTR lead to more effective mRNA destabilization [6]. Because miRNAs frequently target hundreds of mRNAs, miRNA regulatory pathways are complex [7]. It is extremely difficultto achieve control of a cancer by manipulating a single factor, because cancer cells easily escape from induced chemical, physical and molecular stresses through alternative pathways [8]. However, miRNAs involved in stemness and the benign state through the simultaneous control of multiple pathways could be expected to curatively convert cancer cells [9]. Given that the presence or absence of miRNAs plays a critical role in tumorigenic processes and that miRNA expression occurs in a disease-specific manner, miRNAs possess great potential as therapeutic targets and novel biomarkers [10].
miRNAs synergistically induce stemness and pluripotency in cancer cells and specifically in 293FT cells [11]. For example, recent studies in reprogrammed human pluripotent stem cells have suggested that the elevated expression of miR-302 family members influenced the cell cycle transition toward homogeneous proliferation. In vivo studies have shown that miR-302 inhibits the tumorigenicity of human pluripotent stem cells (hPSCs) by enhancing multiple G1 phase arrest pathways, rather than by silencing p21Cip1 [12].
Human miR-520d is a minormiRNA that is involved in HER2/neu receptor-related and osteoblast differentiation, although its function in these processes remains unclear [13]. miR-520d-5p upregulation was observed to induce suppressive effects and inhibit metastasis when the expression of human RGM249 (which is present on 10p15) was abrogated by gene silencing [14]. Thus, RGM249 was identified as a candidate miRNA precursor gene that might orchestrate the target genes involved in modulating differentiation, proliferation, malignant alteration or stemness. RGM249 is strongly expressed in poorly differentiated or undifferentiated malignant tumor cell lines (e.g., hepatoma, sarcoma, glioblastoma, thyroid cancer and malignant melanoma) and might play a role in carcinogenesis or the maintenance of differentiation levels. Here we report a novel and striking role for miR-520d-5p in cancer development and stemness in undifferentiated hepatoma cell lines (HLF). In this study, we also analyzed the metabolomics profiles of miR-520d-5p transfectants to evaluate the reprogramming levels, as metabolite levels have been reported to play a role in regulating the epigenetic changes that occur during reprogramming [15]. Furthermore, we examined a key gene that can interact with miR-520d-5p.
MATERIALS AND METHODS
Cells
To determine the in vitro and in vivo effects of hsa-miR-520d-5p expression, we used two cell lines and lentiviral vectors. hiPSCs (HPS0001 and HPS0002) and hepatoma cells (HLF and Huh7) were provided by the RIKEN BioResource Center Cell Bank [16]45 and the Cell Resource Center for Biomedical Research, Institute of Development, Aging and Cancer Tohoku University, respectively. Poorly differentiated or undifferentiated (HLF) and well-differentiated (Huh7) human hepatoma cell lines with strong and weak RGM249 expression, respectively, were cultured in RPMI1640 medium supplemented with 10% FBS and 1% penicillin/streptomycin. To maintain the undifferentiated states of virus-transformed cells, the cells were cultured in ReproStem medium (ReproCell, Tokyo, Japan) with 10ng/ml of bFGF-2. To examine the effects of miR-520d-5p on normal human dermal fibroblasts in vitro and in vivo, we used adult NHDF (NHDF-Ad) and neonatal NHDF (NHDF-neo) cells (TAKARA BIO, Tokyo, Japan) and cultured them with the FGM-CD BulletKit (TAKARA BIO). Additionally, for comparison with HLF cells or hiPSCs, the human mesangial cell line 293FT (Invitrogen Japan K.K., Tokyo, Japan) was used for its potent facility for hiPSC induction, as previously reported [17]. 293FT cells were cultured in DMEM supplemented with 10% FBS, 0.1 mM MEM non-essential amino acid solution, 2 mM L-glutamine and 1% penicillin/streptomycin.
Lentiviral Vector Construct
To examine the effects of miR-520d-5p overexpression, we transfected pMIRNA1-miR-520d-5p/GFP (20 μg; System Biosciences, Mountain View, CA, USA) or the mock vector pCDH (20 μg) into 293FT and HLF cells (5 × 10⁶ cells/10 cm culture dish). To investigate the effects of miR-520d-5p silencing, we transfected pRNATinH1.4/Lenti-520d-5p (20 μg; Genscript, Piscataway, NJ, USA) or the mock vector pRNATinH1.4/Lenti(20 μg) into HLF cells. To harvest viral particles, the cells were centrifuged at 170,000 ×g (120 min, 4°C). The viral pellets were collected and viral copy numbers were measured with a Lenti-XTMqRT-PCR Titration kit (Clontech, Mountain View, CA, USA). For 293FT or HLF cell infection, one million lentiviral copies were used per 10-cm culture dish. We transfected 50 nM synthesized oligonucleotides into 293FT cells with FuGENE HD Transfection Reagent (Roche Diagnostics, Basel, Switzerland). To confirm the induction of 520d-HLF differentiation into osteoblasts, the cells were treated with 2 M purmorphamine in routine RPMI1640 medium for one week. To confirm the status of ELAVL2 as a candidate target gene of miR-520d-5p, four siRNAs (AAD63-B9, 10, 11 and 12) specific for ELAVL2 (shELAVL2-pLKO.1) were purchased from Thermo Fisher Scientific Inc. (Waltham, MA, USA). pLKO.1 and scramble siRNAs were used as controls. The siRNAs were transfected together into HLF cells via lentiviral constructs according to the optimized method. The representative gene expression levels in HLF cells that were treated with si-520d or 520dOE via pRNATinH1.4/Lenti or pMIRNA/Lenti/GFP, respectively, are shown. To estimate the effects of doxycycline-treated si-520d or 520dOE, doxycycline-untreated HLF cells or pCDH/lenti/GFP-treated cells were used as controls. To confirm the effects of Oct4, Nanog and p53 upregulation and AID downregulation in HLF cells, lentiviral vectors (FU-tet-hOCT4, Efla_NANOG_Ires-Puro and GFP-p53) were purchased from Addgene (Cambridge, MA, USA), while shAID-pLKO.1 was purchased from Thermo Fisher Scientific Inc. (Waltham, MA, USA).The ELAVL2-specific shRNA was purchased from Genecopoeia(Rockville, MD, USA).The siRNA sequences for ELAVL2 were as follows: B9, 5'-ccgugacuuuaacaccautaa-3'; B10, 5'-cgcauuauuacuucucguauu-3'; B11, 5'-gucuccuuuaagacaaacaaa-3' and B12, 5'-gcuucuaucagagaugcaaau-3'. The scrambled sequences for miR-520d-5p and ELAVL2 were 5'-gaguccgcctcuatagacaa-3' and 5'-auucguuguuauugu-3', respectively.
Immunodeficient mice and in vivo experiments
After a 1-week lentiviral infection, 5 × 10⁷ HLF cellswere harvested and injected intraperitoneally or subcutaneously into the right flank (injection volume, 200 µl) of each mouse. Six-week-oldimmunodeficient mice (KSN/Slc; Shimizu Laboratory Supplies, Kyoto, Japan) were fasted for 24 hours before the experiments but were allowed free access to water and feed for 4–12 weeks after the injections; subcutaneously injected mice (n = 51) were observed for 4–8 weeks, while intraperitoneally injected mice (n = 20) were observed for 8 weeks prior to anesthetization with 100 mg/kg Nembutal and then sacrificed foranatomic and histological examinations. Prior to the endpoint, 59 mice were inoculated subcutaneously in a dose-dependent manner (8 mice for 10% transduction efficiency, 22 for 30% and 29 for 60%). Next, 20 mice received 520d-HLF cells that had been sorted for ALP and GFP positivity to examine the influence of differences in culture conditions between media that maintained the undifferentiated status and RPMI1640/10% FBS. Tumor volumes were determined according to the following formula: volume = π/6 × width × length × height. To examine the conversion of well-differentiated hepatoma cells (Huh7) to pluripotent cells with concomitant p53 upregulation or examine the effects of miR-520d-5p on human fibroblast cell lines, an in vivo study was performed in immunodeficient mice. After transfection with the same viral vehicle titer used in the previous in vivo study with HLF cells, the tumorigenicities of the transfectants (520d-5p-Huh7, 520d-5p-NHDF-neo and 520d-5p-NHDF-ad) were confirmed at one week or one month after inoculation for 520d-5p-Huh7 or at three months for 520d-5p-NHDFs.
All animals were housed and fed in the Division of Laboratory Animal Science of Tottori University under a protocol that was approved by the Japanese Association for Accreditation for Laboratory Animal Care, and the animal research and handling were performed in strict conformance with federal Institutional Animal Care and Use Committee guidelines. All experiments reported in this study were approved by an institutional committee.
RT-PCR
Total RNA, inclusive of the small RNA fraction, was extracted from cultured cells or homogenized mouse tissues with the mirVanamiRNA Isolation Kit (Ambion, Austin, TX, USA). Mature miRNAs were quantified with a Mir-X™ miRNAqRT-PCR SYBR® kit (Clontech) according to the manufacturer’s instructions. miRNA (25 ng/μl) was quantified with a Mir-X miRNAqRT-PCR SYBR Kit (Takara Bio Inc., Tokyo, Japan) to confirm siRNA suppression and evaluate changes in miRNA expression. Gels were run under the same experimental conditions.PCR and data collection analyses were performed with a BioFluxLineGene (Toyobo, Nagoya, Japan). The expression levels in the samples were determined according to the standard curve method. All data, except those for hTERT, were normalized to the internal control β-actin. hTERTexpression was estimated from the copy number, according to a previously developed quantification method [18]47. U6 small nuclear RNA was used as an internal control. Total RNA (50 ng/μl) was reverse transcribed and amplified with the OneStep RT-PCR kit (Qiagen, Tokyo, Japan). RNA quantification was confirmed by high-reproducibility sequencing. Supplementary Table S1 shows the primer sequences that were used for mRNA or miRNA quantification. The data were analyzed statistically with a one-way ANOVA or Mann-Whitney U test, and significant differences are shown as *: P < 0.05 and **: P < 0.01.
Western Blotting
We performed western blotting with 20 μg/μl of proteins and the i-Blot gel transfer system (Invitrogen, Tokyo, Japan). Anti-hTERT, p53, Oct4, AID, albumin (Alb) and ELAVL2 antibodies were used at 1:500 dilutions, and the anti-β-actin antibody was diluted 1:1,000 according to the manufacturer’s instructions. Chemiluminescent signals were detected within 1 min with LAS-4000 (Fujifilm, Tokyo, Japan).The gels were run under the same experimental conditions.
Migration Assay
The invasive abilities of transfectants were estimated with a CIM-Plate 16, which detects cell invasion/migration in real time, according to the manufacturer’s instructions (xCELLigence system, Roche, Basel, Switzerland).
Immunocytochemistry
The immunohistochemical examination was performed with antibodies to detect pluripotent markers (anti-Oct4 or anti-Nanog) and with an Embryonic Stem Cell Marker Antibody Panel, according to the manufacturer’s instructions (R&D Systems, Minneapolis, MN, USA). 293FT, Huh7 and HLF cells were infected with lentiviral particles that contained hsa-miR-520d-5p. Floating transfectants were harvested and transferred to new culture dishes for microscopic examinations or to slide chambers for immunostaining.
Immunohistochemistry
During the immunohistochemical analyses, 4% paraformaldehyde-fixed liver tissue specimens were processed [19]. The following monoclonal antibodies were used: anti-hAlb, anti-hAFP and anti-hGFAP (Sigma, St Louis, MO, USA). As a negative control, tissues were stained without the primary antibody. A pathologist estimated the degree of protein expression.
Cell Cycle and Cell Sorting Analysis
Cell cycle analysis and cell sorting were conducted to confirm that the 520d-293FT and 520d-HLF cells comprised pluripotent cell populations. The DNA content was analyzed with a flow cytometer (Epics Altra; Beckman Coulter Inc., CA, USA); the cells were assessed from approximately 20,000 collected events after the transfection of a pMIRNA1-miR-520d-5p/GFP clone, using EXPO32 ADC Analysis software. GFP-positive cells were sorted on a Moflo XDP cell sorter (Epics Altra; Beckman Coulter Inc.). In detail, for cell cycle analysis, a single cell suspension was washed once with cold PBS. The cell pellet was loosened by shaking the tube gently and was fixed with 3.7% formalin in ddH2O, added dropwise. The cells were then incubated at least overnight at -20°C. After fixation, the cells were washed twice with cold PBS to remove the EtOH, resuspended at 1 × 10⁶ cells/ml in PBS with 100 U/ml RNaseA and incubated for 50 min at 37°C. Next, 50 µg/ml of propidium iodide were added, and the mixture was incubated for 40 min on ice in the dark. The DNA content was analyzed with a flow cytometer; the cells were assessed from approximately 20,000 collected events after the transfection of a pMIRNA1-miR-520d-5p/GFP clone, using the EXPO32 ADC Analysis software. GFP-positive cells were sorted on a Moflo XDP cell sorter.
Next, the flow cytometric purification of GFP-expressing or PE-positive cells was performed. The cells were maintained in an immature state for two weeks after viral transduction. 293FT and HLF cells were resuspended in PBS with 5% FCS. After the cells were stained with a PE-conjugated anti-ALP antibody, GFP or PE-positive cells were sorted and analyzed on a Moflo XDP cell sorter against an argon laser (488 nm, 100 mW). A total of 1 × 10⁸ cells were analyzed for forward scatter, side scatter and PE and GFP fluorescence. The FL1 and FL2 channels were used to detect GFP and PE, respectively.
Histological Examination
Lung, liver, intraperitoneal orpostperitoneal metastases and tumor volumes were investigated macroscopically or under a dissecting microscope with bright-field imaging. Tissue samples were fixed in 10% buffered formalin overnight, washed with PBS, transferred to 70% ethanol, embedded in paraffin, sectioned and stained with hematoxylin and eosin (HE).
Fluorescence Detection in Cells
To estimate the efficacy of infection with the miR-520d-5p-expressing lentiviral vector, GFP expression was detected with an OLYMPUS IX71 microscope and TH4-100power supply for themicroscope (Tokyo, Japan).
Target Prediction of Specific miRNA
Algorithms were used to predict the specific miRNA targets (Cosmo Bio, Tokyo, Japan). Figure 5A shows the predicted target genes of hsa-miR-520d-5p. For the Venn diagram, we used the following databases: TargetScanHman6.0 (http://www.targetscan.org/vert_60/), microRNA.org (http://www.microrna.org/microrna/getMirnaForm.do), Pictar (http://pictar.mdc-berlin.de/), RNA hybrid (http://bibiserv.techfak.uni-bielefeld.de/rnahybrid/ submission.html) and miRBase (http://www.mirbase.org/).
Metabolomic Analysis and Sample Preparation
To examine the metabolic profiles associated with induced pluripotency accompanied by non-cancerous properties, we used an untargeted metabolomics approach to analyze the relative abundances of metabolites in normal or pluripotent cells derived from human hepatoma cells (HLF). The quantified measurements and analysis of approximately 900 metabolites were performed by Human Metabolome Technologies (HMT; Tsuruoka, Yamagata, Japan). The following cell types were used in this study: HLF, mock-HLF, 520d-HLF (5D), 520d-HLF (7D) and 520d-HLF (R1 and R2) sorted with both GFP and alkaline phosphatase (ALP). In detail, the five days post-transfection group (5D) presented with malignant tumors in vivo, whereas 7D, R1 (cells sorted with pluripotent markers and GFP that led to teratoma formation or normal liver tissue development) and R2 (cells sorted with pluripotent markers and GFP that led to no tumor development) presented with benign phenotypes in vivo. CE-TOFMS was conducted using an Agilent Capillary Electrophoresis System equipped with an Agilent 6210 Time of Flight mass spectrometer, an Agilent 1100 isocratic HPLC pump, an Agilent G1603A CE-MS adaptor kit and an Agilent G1607A CE-ESI-MS sprayer kit (Agilent Technologies, Waldbronn, Germany). LC-TOFMS was conducted on an Agilent 1200 HPLC pump equipped with an Agilent 6210 Time of Flight mass spectrometer (Agilent Technologies). These systems were controlled by the Agilent G2201AA ChemStation, version B.03.01, for CE and MassHunter for LC software packages (Agilent Technologies). Data acquisition was performed with Analyst QS Build: 7222 software for the Agilent TOF (Applied Biosystems, Foster City, CA, USA/MDS Sciex, Ontario, Canada).
Measurements of the extracted metabolites were performed using CE-TOFMS as described previously [20] with a commercial electrophoresis buffer (Solution ID H3302-1021; Human Metabolome Technologies Inc., Tsuruoka, Japan). Peak extraction was conducted with a modified version of the open source software MathDAMP [21]. Peak alignment was performed according to the m/z values and normalized migration times. Next, the peak areas were normalized against those of the internal standards MetSul and CSA for cationic and anionic metabolites, respectively. The resulting relative area values were further normalized to the sample amount (105 cells), and the average values were calculated for each group. Annotation tables were produced from the CE-TOFMS and LC-TOFMS measurements of standard compounds and aligned with the datasets according to similar m/z values and shifts in the retention times of the LC-TOFMS measurements. Student’s t test was used for comparisons of compound levels between sample groups. The metabolic pathway map used was the Analysis of Networks containing Experimental Data (VANTED, http://vanted.ipk-gatersleben.de/) [22]. To examine the metabolic profile associated with induced pluripotency accompanied by non-cancerous properties, we used an untargeted metabolomics approach to analyze the relative abundances of metabolites in normal or pluripotent cells derived from HLF.
Measurement of 5-hydroxymethyl-cytosine (5-hmC; %)
5-Hydroxymethlyl-cytosine was measured in HLF, mock-HLF and 520d-HLF cells (3D, 5D, 7D, R1 and R2; 200 ng each) with the MethylFlashHydroxymethylated DNA Quantification kit (Colorimetric) according to the manufacturer’s instructions (EPIGENTEK, Farmingdale, NY, USA).
Estimation of ELAVL2 as a target gene of miR-520d-5p
Based on the predicted target genes of miR-520d-5p (MIMAT0002855: cuacaaagggaagcccuuuc) according to various databases (miRBase; http://www.mirbase.org, DIANA-MICROT; http://diana.cslab.ece.ntua.gr/DianaTools/, miRDB; http://mirdb.org, RNA22-HAS; http://cm.jefferson.edu/rna22v1.0, TargetMiner; http://www.isical.ac.in/~bioinfo_miu, mircoRNA.org; http://www.microrna.org/microrna and TargetScan-VERT; http://www.targetscan.org/cgi-bin/targetscan/vert_50) and after confirming gene downregulation by RT-PCR, we examined gene expression in cells transfected with four types of siRNAs against ELAVL2 (siELAVL2-HLF; see the lentiviral vector construct section) and compared this with gene expression in 520d-HLF cells. We performed RT-PCR, western blotting, immunocytochemistry and cell cycle analysis as described previously. To investigate the binding of miR-520d-5p to the 3’UTR of ELAVL2, sequences (or mock mismatch sequences) that corresponded to predicted sites were ligated into the multiple cloning site (MCS; PmeI and XhoI) of psiCHECK-2 (Promega KK, Tokyo, Japan). The signals were detected with a dual luciferase reporter expression assay (Promega KK, Tokyo, Japan). Synthesized miR-520d-5p (MBL, Nagoya, Japan) or pMIR-520d-5p were co-transfected into HLF cells with each prepared expression vector. Synthesized hsa-miR-520-3p (MBL, Nagoya, Japan) or pLKO.1 (Addgene, Cambridge, MA, USA) with the mismatch sequence were used as controls. Forty-eight hours after transfection, the luciferin expression (RLU) was measured on an Infinite F500 (TECAN, Männedorf, Switzerland). RLU (renilla/firefly) activity was standardized to that of a control (n = 4). siELAVL2-HLF cells were injected into the right hindquarters of immunodeficient mice that were fed routinely for two months and observed for tumorigenicity and estimations of tumor quality.
The following four pairs of sequences were inserted into psiCHECK-2: ELAVL2-3’UTR sense 1, 5’-TCGAGAACAGTATTTATTTTGTAAGTTT-3’; ELAVL2-3’UTR antisense 1, 5’-AAACTTACAAAATAAATACTGTTC-3’; ELAVL2-3’UTR sense mock 1, 5’-TCGAGAACAGTATTaaTATTTTGTAAGTTT-3’; ELAVL2-3’UTR antisense mock 1, 5´-AAACTTACAAAATAttAATACTGTTC-3’; ELAVL2-3’UTR sense 2, 5’-TCGAGACGTCCTGCTTTTTGTAGTTT-3’; ELAVL2-3’UTR antisense 2, 5’- AAACTACAAAAAGCAGGACGTC-3’; ELAVL2-3’UTR sense mock 2, 5’- TCGAGACGTCCTGCaaTTTTTGTAGTTT-3’; and ELAVL2-3’UTR antisense mock 2, 5’-AAACTACAAAAAttGCAGGACGTC-3’.
STATISTICAL ANALYSIS
A Mann-Whitney U test or one-way ANOVA was used for comparisons between the control, mock and miR-520d-5p or si-520d groups with one observed variable. P < 0.05 was considered significant (*: P < 0.05, **: P < 0.01). In the box plots, the top and bottom of each box represent the twenty-fifth and seventy-fifth percentiles, respectively, thus providing an interquartile range. The line through the box indicates the median, and the error bars indicate the fifth and ninety-fifth percentiles.
RESULTS
In vitro Study of miR-520d-5p-lentivirus-infected HLF
HLF cells that were infected with a miR-520d-5p-expressing lentiviral vector (520d-HLF; hsa-miR-520d-5p-overexpressing HLF) were converted to spherical cell populations of 20–50 cells per 10-cm plate in ReproStem (Figure 1A; top middle) and were found to express the pluripotent marker Nanog (Figure 1A; top right). Figure 1A shows the morphological changes in the HLF cells (top left). Cells that were cultured in RPMI1640 expressed GFP and the pluripotent marker Oct4 (bottom). GFP was used for the identification of transfectants by fluorescence microscopy. In all cases, the transcription of Oct4, Nanog and p53 was upregulated in 520d-HLF cells compared with mock-HLF cells at three days post-transfection. Representative immunocytochemical findings are shown in Fig. 1A. In contrast, the RGM249, CD44 and albumin (Alb) expression levels were significantly downregulated (**: P < 0.01; Figure 1B). Western blotting showed that the Oct4 and p53 protein levels were upregulated. The expression of activation-induced cytidine deaminase (AID), and Alb were suppressed in 520d-HLF cells (Figure 1C). In migration assays, most of the pluripotent marker-positive cells could not pass through the fibronectin membranes (5 µg/ml per 6-well dish), whereas mock-HLF cells could pass through easily (Figure 1D). The 520d-HLF cells also had significantly lower levels of methylation markers (histone deacetylase (HDAC), Sin3A and methyl-CpG binding domain protein 3 (MBD3)) than did the mock-HLF cells (P < 0.01; Supplementary Figure 2C; bottom). 520d-HLF cells showed a characteristic proliferative network structure (Figure 1E). A cell cycle analysis of 520d-HLF cells showed increases and decreases in the S and G1/G0phases, respectively, relative to the mock-HLF cells (Figure 1F). hTERT (human telomerase reverse transcriptase) and Alb were found to be downregulated in all 520d-HLF clones (n = 9) that had been cultured for more than a month in ES cell medium, compared with the levels in the HLF cells. In contrast, the Oct4 and p53 expression levels were significantly upregulated in 520d-HLF cells, and Nanog expression was elevated in eight clones. There were no significant regulatory changes in c-Myc expression. The expression of CSC markers (PROM1) was not significantly different between HLF, hiPSCs (human induced pluripotent stem cells) and 520d-HLF cells (Figure 1G), but CD44 expression was significantly decreased in 520d-HLF cells (P < 0.01; Figure 1B). From the PE-positive HLF cells, GFP (+) and alkaline phosphatase (ALP)-PE (+) cells were selected and maintained as immature populations for 2 weeks after sorting (Figure 1H, Supplementary Figure 2E). The ALP-PE (+) populations strongly expressed Nanog (Figure 1I). To confirm whether changes in the expression of these genes provided clues regarding the underlying mechanism, we lentivirally transfected cells with a short interfering RNA (si-520d) that corresponded to miR-520d-5p. We observed that the levels of AID and Nanog expression were the converse of those observed in cases of miR-520d-5p overexpression (520dOE). There was a significant inverse correlation between the Nanog and AID expression levels in the si-520d and 520dOE cells. However, neither p53 nor Oct4 was downregulated in the HLF cells transfected with si-520d (Figure 1J). The results from the same experiments conducted in 293FT cells (rather than in HLF cells) are shown in Supplementary Figure 2 and S1.
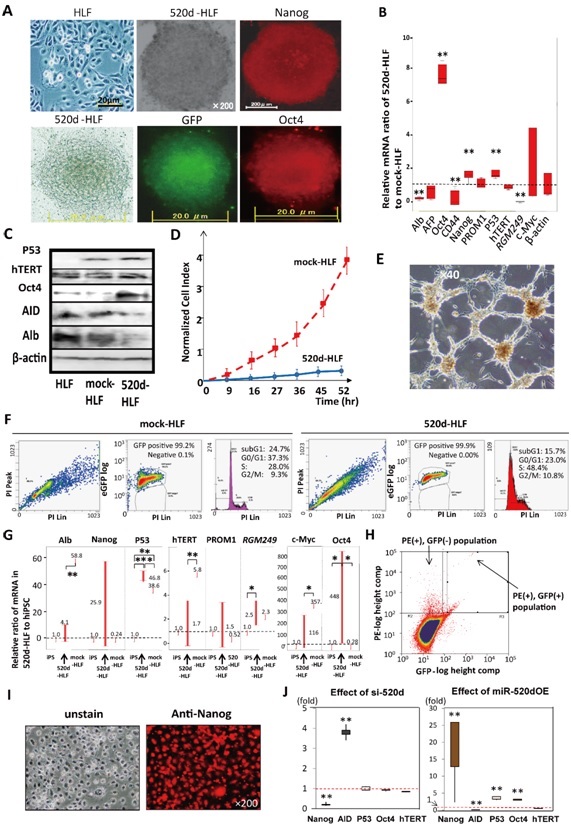
Figure 1: (A) Microscopic findings (2003 magnification) of 520d-HLF cells cultured in RPMI1640, with a similar phenotype to pluripotent spheroid cells, GFP expression (bottom middle) and Oct4 expression (bottom right). 520d-HLF cells cultured in ReproStem were spherical (top middle; 2003 magnification) and expressed Nanog (top right). HLF are also shown (top left: 403 magnification). (B) The relative ratio of the 520d-HLF to mock-HLF mRNA levels was compared with respect to representative genes at three days post-transfection. Oct4, Nanog and p53 were significantly upregulated (N 5 9). (C) Western blotting showed that the p53 and Oct4 protein levels in 520d-HLF cells were upregulated compared with those in mock-HLF cells, but the Alb, AID and Dicer1 levels were downregulated. (D) The invasive abilities of mock-HLF and 520d-HLF cells were estimated in a migration assay, using a fibronectin membrane. Most of the 520d-HLF cells could not pass through the membrane. (E) 520d-HLF cells proliferated in a characteristic network structure (403 magnification). (F) FACS analysis showed that the GFP-positive 520d-HLF cells (right) had a higher DNA content in the S phase than the GFP-positive mock-HLF cells (left). (G) The relative ratios of transcriptional expression in 520d-HLF cells that were cultured for one week after transfection with hiPSCs are depicted. Numbers above the upper bars indicate the average ratios. 520d-HLF cells expressed Alb, Nanog, hTERT, PROM1 and c-Myc at similar levels to those in hiPSCs, whereas the p53, RGM249 and Oct4 levels were upregulated in 520d-HLF (n 5 9). (H) To sort PE-positive HLF cells, ALP-PE (1) and GFP (1/2) cells were selected, as indicated by the arrows, and maintained in an immature state for two weeks after sorting. (I) ALP-PE (1) populations showed stable Nanog expression (2003 magnification). The cells grew slowly and expanded even under culture conditions intended to maintain an immature state. (J) To confirm the effects of miR-520d-5p on Nanog, AID, p53 and Oct4 gene expression, the relative expression levels were estimated with siRNA for miR-520d-5p (si-520d; left) or miR-520d-5p (520dOE; right; n 5 4). OE: overexpression. **: P , 0.01: the Mann– Whitney U test.
In vivo Study of miR-520d-virus-Infected HLF
To examine the correlation of the in vivo results with viral titer-dependent efficacies, 1.0 × 10⁶ HLF cells were infected with 1.0 × 10⁵ to 1.0 × 10⁶ viral copies, and athymic KSN/Slc mice were then inoculated with the cells. Infection of cells with 1.0 × 10⁵ (n = 8) or 3.0 × 10⁵ (n = 22) viral copies resulted in the generation of approximately 10-mm or 1-mm undifferentiated hepatomas, respectively, upon inoculation of mice; each mouse in the xenograft model developed a malignant tumor. Tumor volumes were significantly lower in mice that had been inoculated with cells infected with more than 3.0 × 10⁵viral copies, than in mice received cells infected with 1.0 x 10⁵ viral copies. In contrast, HLF cells that were infected with 1.0 × 10⁶viral copies (n = 22) did not generate any malignant tumors in mice; each recipient developed a benign tumor. Of the mice that received cells infected with 6.0 × 10⁵ copies (n = 29), two generated homogeneous malignant tumors, one generated a teratoma, one generated homogeneous liver tissue, and one generated heterogeneous tissue that comprised both mature undifferentiated tumor cells, which were categorized in pathological terms as a mature teratoma, and normal liver tissue, which was partly accompanied by calcification (Figure 2A). In contrast, 100% of the mock-injected mice (n = 20) had white nodules (histologically undifferentiated hepatoma cells according to hematoxylin and eosin (HE) staining) in the peritoneum or liver (Figure 2A; right). Only one of 20 mice that received intraperitoneal injections generated an intraperitonealteratoma; one mouse formed a subcutaneous liver tissue or teratoma (along the injection site), and 18 mice never developed intraperitoneal or subcutaneous tumors or benign tissues. Heterogeneous tissues that comprised mature teratomas and liver tissues were also observed in a mouse that received cells transfected with 6.0 × 10⁵ copies. Thus, a viral dose-dependent suppression of tumorigenicity was observed, and the ratio of malignant tumors to all tumors indicated a dose-dependent transition to benignancy (Figure 2B). In this study, two distinct types of benign tissues, specifically normal liver and mature teratoma-like tumors, were observed subcutaneously or intraperitoneally. These representative tumors comprised normal liver tissue with calcification (top) and a mature teratoma with normal liver tissue (bottom; Figure 2C). A summarized in vivo study of a sufficient and effective viral titer (1 copy/cell) demonstrated that 7% and 6% of murine recipients developed normal liver tissues and mature teratomas, respectively, whereas those that received mock-HLF cells developed undifferentiated tumors. Overall, among the 520d-HLF-injected mice, 90% (n = 64 of 71; the 71 mice included n = 22 in Fig. 2A that received 1.0x10⁶ copies) did not develop tumors, although they did generate benign or normal tissues (n = 7); each of these mice exhibited a benign tumor. Eighty-seven percent of the murine recipients of transfected HLF cells did not form tumors or metastases. Mock-HLF recipients formed multiple peritoneal cavity nodules (Figure 2D). A mouse that had been inoculated with 520d-HLF cells generated intraperitonealteratoma tissue (dermoid cyst) over an 8-week period (Figure 2E, 2H; left, histological specimen with HE staining); during the same period, mice that had been inoculated with mock-HLF cells generated multiple metastatic nodules that comprised undifferentiated cells (Figure 2F). Other mice that had been inoculated with 520d-HLF generated intraperitoneal teratomas (Figure 2G; top, HE staining) and subcutaneous liver tissues (Figure 2G; bottom, HE staining) over an 8-week period (size > 10 mm). The benign liver tissue specimens included the central vein, bile ducts (Figure 2H; right, white arrow) and hepatic cords (Figure 2H; second from right). Moreover, in mice, 520d-HLF cells gave rise to teratomas that comprised dermoid cysts with epidermis, sudoriferous glands, sebaceous glands (Figure 2H; 2nd to left: white arrow) and apocrine-secreting glands over an 8-week period (Figure 2H; top by HE staining). The generated teratomas and liver tissues expressed GFP protein (Figure 2I; left, HE and right, GFP, respectively). Other transfected cells did not generate any specific tissues or tumors, including metastatic nodules. ALP and GFP-sorted 520d-HLF cells (R1, R2), which were subsequently used for metabolomic analyses and secretory protein arrays, never generated subcutaneous or intraperitoneal tumors or other tissues in immunodeficient mice. Almost all of the hepatocytes in the liver tissues strongly expressed albumin (hAlb), as determined by immunohistochemical staining (Supplementary Figure S3A; left). hAlb was used as a differentiated hepatocyte marker, and the in vivo results indicated differentiation (Supplementary Figure S3A; left), whereas the in vitro results revealed an undifferentiated state (Figure 1B). α-fetoprotein (hAFP), shown in Supplementary Figure S3A (middle), and the hepatic stellate cell/myofibroblast marker glial fibrillary acidic protein (hGFAP), shown in Supplementary Figure S3A (right), were weakly expressed, suggesting that 520d-HLF cells differentiated into immature liver tissues (top, 100x and bottom, 400x magnification). Moreover, an in vitro stimulation with 2 μM purmorphamine, an agent that promotes osteoblast differentiation, in RPMI1640 converted 520d-HLF cells to an osteoblast-like phenotype (Supplementary Figure S3B; top) and induced the significant upregulation of IBSP (osteopontin) and SPP1 expression (bone sialoprotein; P < 0.01; Supplementary Figure S3C).
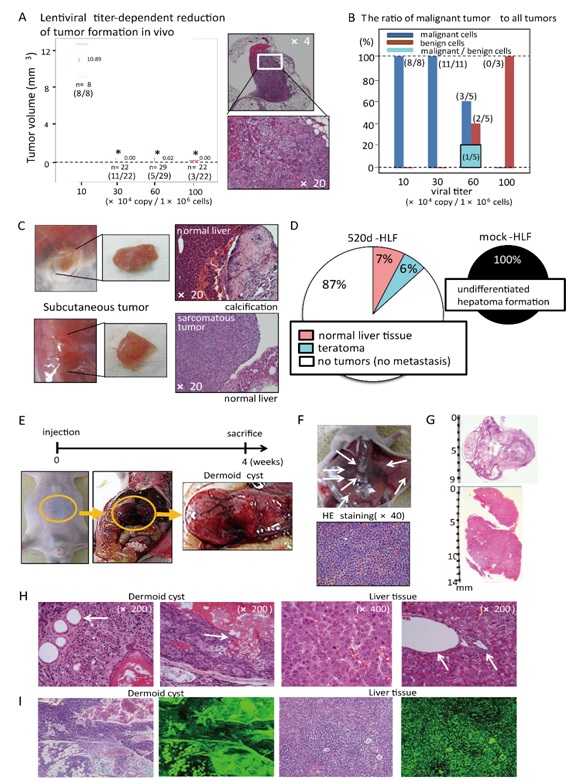
Figure 2: (A) Tumor volumes were significantly lower in mice inoculated cells with more than 3.0 than 1.0 3 105 copies (left). HE staining of a representative 10-mm malignant tumor generated from cells transfected with 1.0 3 105 copies (right; top, 43 magnification and bottom, 203 magnification). **: P , 0.01. (B) Benign tumors, including mature teratomas and normal liver tissues, as well as malignant undifferentiated tumors were obtained from mice inoculated with more than 6.0 3 105 viral copies. (C) Representative subcutaneous tumors from abdominal wall (top) and hindquarter (bottom) injection sites. Normal liver tissue with partial calcification (top) and normal liver tissue with mature teratoma (bottom) are shown. Microscopic findings of an approximately 1-mm-diameter tumor (left), a resected tumor (middle) and HE staining (right, 203 magnification). (D) Circle graph in which tissues generated in vivo from HLF cells that received 1.0 3 106 copies (left) were itemized and compared with tumors from mock-transfectants (right). (E) 520d-HLF cells were injected intraperitoneally into mice (n 5 20) prior to sacrifice eight weeks later. Three mice presented with macroscopic dermoid cysts, also known as benign mature teratomas. The yellow circle indicates the location of one of them in a mouse. (F) Mock-HLF cells formed intraperitoneal nodules in all mice (white arrows). HE staining (403 magnification) of a representative nodule was histologically identical to that observed with HLF cells. (G) A representative dermoid cyst (top) and liver tissue specimen (bottom) resected from mice were placed on a glass slide and HE stained. (H) White arrows correspond to the epidermis, sudoriferous glands and sebaceous glands in the dermoid cyst (HE, 2003 magnification; left and second from left). One of eight mice formed subcutaneous liver tissues in the abdominal wall (Fig. 4G; bottom). Normal liver tissues with hepatic cell cords (second from right; 4003 magnification), a central vein and a bile duct (right, 2003 magnification) were observed (white arrows). (I) GFP expression was confirmed in teratomas and liver tissues resected from mice. HLF cells were successfully transfected with GFP and miR-520d, and GFP expression was maintained in the developing tissues. Left: HE staining, right: GFP expression.
We also examined miR-520d-5p-mediated pluripotency induction in Huh7 (well-differentiated hepatoma) cells. Oct4 and Nanog expression in the small round cell population was more elevated compared to that with mock vector induction. Four 7-day infection sessions with 1.0 × 10⁶ copies of the viral vector per 1.0 × 10⁶ cells were required to induce Oct4 and Nanog expression in 520d-Huh7 cells (Supplementary Figure S3D; top left, GFP and top right, Oct4). The Nanog, p53, Oct4, Lin28 and miR-520d-5p expression levels were upregulated, while the hAlb, AID and RGM249 levels were downregulated (Supplementary Figure S3D; bottom, see the Supplementary Figure S3D legend for an explanation of the genes was examined in this study). Additionally, Oct4, Nanog and p53 expression was upregulated and AID was downregulated in HLF cells transfected with lentiviral expression vectors (FU-tet-hOCT4, Efla_NANOG_Ires-Puro, GFP-p53 and shAID-pLKO.1); the cells transfected with these four expression vectors grew slowly, were similar to 520d-HLF cells in vitro and lost their tumorigenicity in vivo.
Metabolomic Analysis
The following cell lines were used in this analysis: HLF, mock-HLF, 520d-HLF (5 days after transfection (5D)), 520d-HLF (7 days after transfection (7D)) and 520d-HLF (R1 and R2), sorted with both GFP and alkaline phosphatase (ALP).We first examined the global metabolomic profiles of induced pluripotent cells derived from cancer cells relative to the mock-HLF or 5D cells with cancerous properties that were used as controls. We detected peaks for 165 metabolites (72 cations and 93 anions) in all groups (see Supplementary Figure S4A for the summarized HMT analysis scheme and Supplementary Figure S4B and S4C for a heat map and PCA, respectively).
The metabolomic profiles of 520d-HLF, R1 and R2 are very similar, which agrees with the overall genetic, epigenetic and functional similarities that have been reported for these pluripotent cell types. We identified 165 metabolites in this study that showed a greater than two-fold difference (P < 0.01) between the 520d-HLF (5D,7D, R1 or R2) and mock-HLF cells (5D and 7D). Seventy-six metabolites showed a greater than 1.5-fold difference (P < 0.05) between 7D, R1 or R2 (benign cells) and 5D (malignant cells) (Figure 3; red or yellow columns indicate quantitative changes of greater than 2.0-fold or 1.5–2.0-fold, respectively). The data indicated high activity with regard to nucleotide synthesis, bioenergetic production, the S-adenosyl methionine (SAM) cycle, glycolysis, the urea cycle and the production of amino acids, such as glutamine; these findings were characteristic of cells with pluripotent or benign properties. We found that the inhibition of oxidative pathways was important to maintain pluripotency. Ketone body production and urea cycle promotion were observed; these functions are mainly observed in the liver. Gluconeogenesis and lipid metabolism were not elevated in these transfectants, indicating that the transformed cells might be immature and nonessential to hepatic development. Generally, the TCA cycle was not elevated in this study, although we found significant elevations in four metabolites (malate, fumarate, succinate and cis-aconitate). Furthermore, other key metabolites were elevated, including GABA(R) and adenosyl methionine.
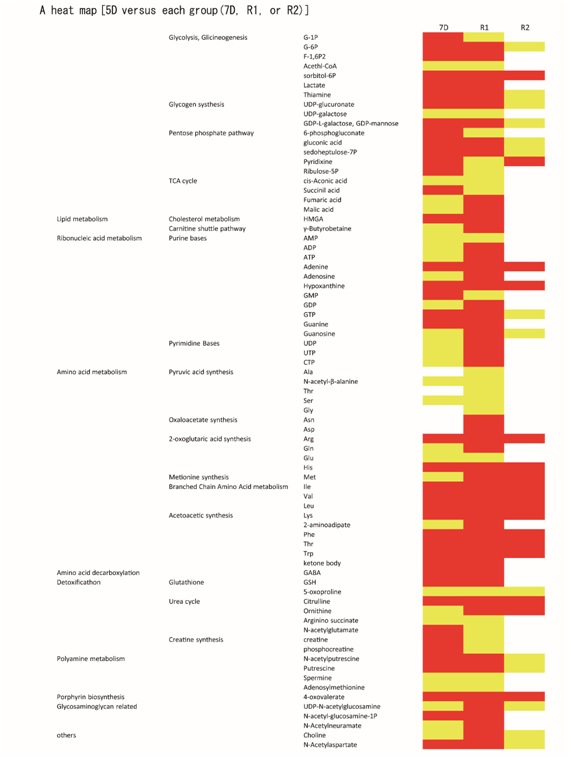
Figure 3: Metabolomic analysis was performed in 520d-HLF cells (5D) that formed malignant hepatoma cellsin vivo, 520d-HLF cells (7D) that did not form hepatoma cells in vivo and R1 and R2 cells sorted from 520d-HLF according to GFP and ALP expression (n 5 4). A heat map analysis of three cell types (7D, R1 and R2 against 5D) is shown. Red or yellow columns indicate quantitative changes of greater than 2.0-fold or 1.5–2.0-fold, respectively. In the analyses performed according to this method, no metabolites were reduced quantitatively in 7D, R1 or R2 cells, compared with 5D cells. The metabolomic patterns were similar to those in iPSCs. The profiles of the 7D and R1 cells showed high similarity to each other, and glycolysis, the SAM cycle and nucleotide synthesis were more elevated in 7D, R1 and R2 than in 5D cells. Microarray analysis between R1 (cell populations forming liver tissue) and iPS was performed and shown in Supplementary Fig. 9–11 (n 5 1) for reference only (TORAY, Kamakura, Japan).
Measurement of 5-hydroxymethyl-cytosine (5-hmC; %)
The general methylation levels in the transfectants were estimated and indicated slight hypermethylation in 5D and hypomethylation in R1 and R2; in particular, there was almost no methylation in R2 (Figure 4; top left).
Altered Gene Expression during the 520d-Mediated Inductive Process in HLF after Transfection
During the inductive process from HLF to iPS-like cells, mediated by miR-520d-5p, the expression levels of p53, Nanog and SIRT1 were significantly upregulated (n = 4; *P < 0.05, Mann-Whitney U test), indicating that p53, AID, Nanog and even ELAVL2 expression are correlated with benignancy and/or immaturity (pluripotency; Figure 4).
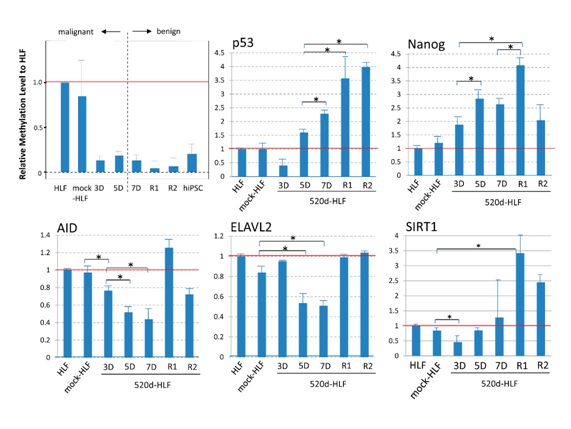
Figure 4: An average hmC (%) was estimated to understand the general methylation level during the miR-520d-5p-induced de-differentiation process. The induction of slight hypermethylation in 5D and a decreasing methylation level in 7D cells were observed (top left). The average methylation rate in HLF cells was 0.45%, and the data were standardized to the results obtained for HLF cells. During the inductive process from HLF to iPS-like cells, mediated by miR-520d-5p, the expression levels of p53, Nanog, AID, ELAVL2 and SIRT1 were examined by RT-PCR. The data were standardized and compared to HLF (n 5 4).
Effects of siELAVL2 on HLF cells in vitro or in vivo
ELAVL2 (embryonic lethal, abnormal vision, Drosophila-like 2) was predicted to be a common target candidate of miR-520d-5p, although more than 8000 genes were predicted by the databases DIANA-MICROT, miRDB, MicroRNA.org and TargetScan VERT (Figure 5A). Four siRNAs (short interfering RNAs) specific for ELAVL2 (siELAVL2) could induce HLF cells to form similar spheroid colonies to those induced by miR-520d-5p (Figure 5B). Oct4, Nanog and p53 expression were upregulated both transcriptionally (Figure 5C) and translationally (Figure 5D) following treatment with the four siELAVL2, suggesting compatibility with the effects of miR-520d-5p. Immunocytochemistry revealed the upregulation of both Oct4 (upper) and Nanog (bottom) in the spheroid colonies (Figure 5E). We determined whether the upregulation of Oct4, Nanog and p53 and the downregulation of AID resulted in similar outcomes in vivo. After the regulatory protein expression levels were confirmed in transfectants, the cells were inoculated into the right hindquarters of KSN/Slc mice (n = 8); these mice did not generate any tumors. A cell cycle analysis of HLF, pLKO.1-HLF (mock-HLF) and siELAVL2-HLF cells (cultured in RPMI1640 or ReproStem) suggested the conversion to cell populations with homogeneous growth in phases S to G2M in the siELAVL2-HLF cells (Figure 5F; bottom). These cells formed a network that radiated from scattered spheroid cells (Figure 5G; top, pLKO.1-HLF as a mock control and bottom, siELAVL2-HLF). A luciferase reporter expression assay demonstrated the suppression of ELAVL2 gene expression by the binding of miR-520d-5p to the 3’UTR of ELAVL2. The ELAVL2 3’UTR sequence (1356-3805) contains 10 putative binding sites for miR-520d-5p (Supplementary Figure S5), and miR-520d-5p bound to two of the most potent sites (508–525 and 880–894 in the 3’UTR and 1853–1880 and 2235–2249 of ELAVL2 gene) in the ELAVL2 3’UTR, resulting in the inhibition of ELAVL2 translation relative to the controls miR-520d-3p or pLKO.1 (contains a mismatch sequence within miR-520d-5p (see Methods); Figure 5H). Both synthesized miR-520d-5p and the miR-520d-5p expression vector could specifically reduce ELAVL2 translation by approximately 50–70%, compared to controls transfected with synthesized miR-520d-3p or pLKO.1. A control expression vector that included mismatch sequences within miR-520d-5p did not significantly affect the luciferase expression, which was similar to that of the empty pLKO.1 vector. An in vivo study in mice inoculated with ReproStem-cultured siELAVL2-HLF cells did not result in the formation of tumors, liver tissues or scars (Figure 5I). Xenografted mice, which received siELAVL2-HLF cells that had been maintained with RPMI1640, generated undifferentiated tumors (2/16), no tumors (4/16), scars (8/16; top in Figure 5I) and differentiated tumors (2/16). The individual cells had swollen and clear nucleoli and cytoplasm with weak basophilia, a vacuole and a fat drop. Many neoplastic cells resembled fibroblasts or myofibroblasts, and the presence of a blood vessel system supported the possibility of differentiation. The immature differentiated tumors revealed the possible presence of fibroblasts, myofibroblastic forms, fat drops, collagen fibers, cytoplasmic vacuoles and/or an immature blood vessel system (Fig. 5I; bottom right, 200xHE staining). However, because ELAVL2 expression increased toward the mock level in siELAVL2-HLF, Huh7 or 293FT cells, presumably it was not needed to maintain the undifferentiated status. Additionally, a mouse that received HLF cells with upregulated Nanog and downregulated AID expression generated a small tumor that comprised immature and differentiated regions such as collagen fibers or cytoplasmic vacuoles (1/16).
Figure 5: Whether siELAVL2 and miR-520d induced similar effects in HLF cells was examined. (A) Representative predicted hsa-miR-520d-5p target genes are shown. Four algorithms predicted 6 genes, as shown in a Venn diagram. ELAVL2 was examined as a possible targeted gene. (B) Two days after transfection with siELAVL2, colonies with spherical phenotypes emerged in a thick-Matrigel-coated culture dish (left, 403 magnification; right, 1003 magnification). One week after transfection, the sizes of the central spherical colonies did not change, but cell growth was observed to radiate in all directions. (C) RT-PCR and (D) western blotting revealed upregulated levels of p53, Oct4 and Nanog (n 5 4). The white bar represents 200 mm. (E) Upregulation of both Oct4 (top) and Nanog (bottom) were confirmed by immunocytochemistry. Oct4 or Nanog expression in controls (parental HLF and scramble-HLF) is also shown in Supplementary figure S8. (F) The cells were cultured under the following conditions: (top) standard medium (RPMI1640/10% FCS) and (bottom) ReproStem medium with 10 ng/ml of bFGF. The cells cultured under different conditions exhibited entirely different phenotypes. However, the DNA contents of these populations indicated a shift toward homogeneous proliferation, with fewer apoptotic cells. (G) A spheroid cell that was shown in (B) grew slowly and scattered over the entire culture dish surface in approximately two weeks. Scattered spheroid colonies were interlinked through long, branched groups of cells (bottom); mock-HLF is also shown (top). (H) Using a luciferase reporter expression assay, two potent miR-520d-5p binding sites in the 3’UTR of the ELAVL2 gene were identified as 1853–1880 and 2235–2249. The minus sign (2) in the synthesized miR-520d-5p represents synthesized miR-520d-3p, and the minus sign in pMIR-520d-5p represents the control vector with mismatch sequences within miR-520d-5p, which was expressed from pMIR-520d-5p (n 5 4). (I) In the in vivo study, siELAVL2-HLF cells generated differentiated specimens that comprised mesenchymal system components (2/16), but a neoplastic property was indicated via the uniform pattern, accompanied by an irregular-spindle shape (2/16). The remaining phenotypes showed scar tissue or no tumors (12/16). *: P , 0.05 and **: P , 0.01 with the Mann-Whitney U test.
miR-520d-related Dedifferentiation Induction in Huh7 cells in vivo
Once per week, we infected cells with viral constructs in vitro. All mock-Huh7 recipients formed well-differentiated hepatomas (Supplementary Figure S3E; n = 10), but 50% (n = 4) of the mice inoculated with 520d-Huh7 cells after a 1-week transfection generated less-differentiated tumors after a month (Supplementary Figure S3F; left); the remaining mice did not generate tumors. HE staining (200x magnification) revealed poorly differentiated hepatomas (Supplementary Figure S3G; left) and poorly-differentiated hepatoma cells (Supplementary Figure S3G; right). Mice that received the transfection for one month did not generate tumors after one month (n = 4), indicating the induction of dedifferentiation in a dose-dependent manner; however, more time was required for the loss of tumorigenicity in the Huh7 recipients.
Additionally, we examined the tumorigenicity of HLF cells with upregulated Nanog and downregulated AID expression (Figure 1J; n = 16); these cells led to no tumor formation (n = 15) or small undifferentiated subcutaneous tumors with an immature and differentiated tumor including collagen fibers or cytoplasmic vacuoles, unlike the undifferentiated hepatoma cells. The pathological findings were similar to those of HLF cells treated with siELAVL2 (n = 2; Figure 5I; bottom). Subsequently, we examined the tumorigenicity of HLF cells with upregulated Oct4, Nanog and p53 and downregulated AID expression in athymic mice; these cells yielded no tumor formation (n = 8). The observed phenotypic changes in HLF cells that were infected with four lentiviral vectors were similar to those observed in 520d-HLF cells in vitro.
Effect of miR-520d-5p on Human Fibroblasts
NHDF-Neo (left) and Ad (right; Supplementary Figure S6A; 200x magnification) were infected with a miR-520d-5p-expressing lentiviral vector, as described previously. The transfectants showed no phenotypic changes when compared with parental cells, but they had a longer lifespan (more than three months) until senescence induction than did the parental cells. Immunocytochemistry revealed upregulated Nanog (right) or Oct4 expression (middle) in the miR-520d-5p-expressing fibroblasts (520d-NHDF-Neo and 520d-NHDF-Ad in each; Supplementary Figure S6B, S6C). To examine the tumorigenicity of the 520d-NHDF-Neo or 520d-NHDF-Ad cells in KSN/Slc mice, transfectants were inoculated into the right hindquarters of KSN/Slc mice. Neither the 520d-NHDF-Neo (n = 8) nor the Ad (n = 8; right) cells generated tumors in mice at 12 weeks post-inoculation (Supplementary Figure S6D).
DISCUSSION
miRNAs have been implicated in numerous biological processes [23]. Accumulating data suggest that miRNA dysregulation occurs frequently in various carcinomas, including those of the lung, colon, stomach, pancreas and liver [3,24]. Many recent studies have attempted to better understand the roles of miRNAs and reveal the function and importance of miRNA-mediated regulation in cancer and normal cells [25]. Aberrant miRNA expression profiles that correlate with particular tumor phenotypes can also be used to distinguish between normal tissues and tumors [26]. Perturbations of miRNA expression levels might also lead to anti-tumorigenesis [27]. Thus, the dual effects of miRNAs in carcinogenesis and normal stem cell differentiation strongly suggest that miRNAs might be involved in the transformation of normal stem cells to CSCs. Although our current understanding of miRNA functions remains incomplete, this study has helped elucidate the intricate roles of miRNAs in the regulation of cellular processes such as differentiation, reprogramming and oncogenesis.
This is the first study to provide evidence that a single miRNA can convert malignant or immortalized cells to benign or normal cells. The stemness-mediated process does not necessarily result in normal cells, but normal hiPSCs form teratomas in vivo [28-30]21-23 and it was thought that tumorigenicity might cause methylation in cells prior to developmental growth [31-33]24-26. In this study, western blotting and RT-PCR were used to show that p53 was stably upregulated in both miR-520d-5p-lentivirus-infected 293FT cells (520d-293FT; hsa-miR-520d-5p-overexpressing 293FT) and 520d-HLF cells, unlike the p53 levels in hiPSCs (Figure 1, Supplementary Figure S2). High titers (600,000-1,000,000 copies) of the miR-520d-5p-expressing lentiviral vector increased the efficacy of this induction through stable changes in translational regulation (Figure 2). Compared to the mock virus-infected 293FT (mock-293FT) and mock-HLF cells, the DNA contents of the 520d-293FT and 520d-HLF cells were increased in the subG1 and S phases, respectively (Fig. 1F, Supplementary Figure S1A). A comparative analysis of the DNA methylation patterns in 520d-293FT and 520d-HLF cells showed the reverse pattern (Supplementary Figure S1C), presumably due to differences in the cell differentiation levels. AID, which binds to the promoter regions of Nanog or Oct4 and regulates pluripotency, was downregulated in both cell types, compared to the parental cells. However, in culture conditions intended to maintain undifferentiated cells, post-transfection AID expression was upregulated in 520d-293FT and downregulated in 520d-HLF cells, indicating the AID-independent regulation of pluripotent markers (Oct4 and Nanog), as these proteins were upregulated in both cell types [34]27. Many cancer cells also express Oct4 and Nanog, and there are many similarities between cancer cells and embryonic stem cells in terms of the stemness process [35]. However, many types of cancer cells downregulate p53 and cannot generate teratomas or original tissues in vivo. DNMT1 (DNA ((cytosine-5-)-methyltransferase), which is upregulated in preneoplastic lesions and poorly differentiated tumors, was also downregulated [36]29, and a compensatory HDAC dysregulation was possibly induced because DNMT1 could not bind to HDAC. Sin3A upregulation might repress Myc and thus exert an anti-oncogenic effect on 293FT cells [37]. The crucial step toward normal methylation or epigenetic modification might be the suppressive regulation of AID and DNMT1, as both proteins play important roles in carcinogenesis and cancer progression [31-34]. It is possible that either a DNMT or an AID inhibitor alone could reprogram mouse fibroblasts to iPSCs without viral induction, but this has not yet been achieved and we think that AID might be a crucial factor in the reprogramming of cancer cells such as KLM-1, PK9, PK-45p or HT1080, as well as HLF, because AID expression might negatively regulate Oct4, Nanog and p53 (Figure 6).
Figure 6: In somatic cells, AID upregulation can induce carcinogenesis through p53 mutations and subsequent downregulation, and can thus lead to the downregulation of Nanog and Oct4 and differentiation through methylation. In pluripotent normal cells, Nanog and Oct4 can maintain their upregulated status through an inability of the AID protein to bind to the promoter regions of both Oct4 and Nanog. In cancer cells, AID upregulation can maintain malignancy through Nanog, Oct4 and p53 downregulation. On the other hand, the AID protein did not bind the demethylated promoter regions of activated Oct4 and Nanog in ES cells (top). Both somatic cells and undifferentiated cancer cells were transfected with miR-520d-5p, but AID downregulation could not induce p53 downregulation by inhibiting the p53 mutation status and carcinogenesis. Simultaneously, Nanog and Oct4 upregulation might induce de-differentiation (or pluripotency) and benignancy by maintaining demethylation (bottom). Therefore, miR-520d-5p can presumably induce Nanog, Oct4 and p53 upregulation in both normal cells and cancer cells.
miR-520d-5p converted even well-differentiated hepatoma cells (Huh7) to non-tumorigenic cells via less-differentiated and tumorigenic hepatoma cells. A stringent conditioning regimen directed toward differentiation should be determined because the histology of the generated tissues was almost homogeneous, and the outcomes of the diverse phenotypes (teratoma, hepatic tissue or no tumor formation) in vivo might depend on the reprogramming level and/or p53 expression levels. Additionally, the metastatic properties of 520d-HLF were suppressed in vitro and in vivo. The DNA percentage of 520d-HLF cells was increased in the S phase; this result might be compatible with a report in which mir-302a/b/c/d coexpression drove homogeneous proliferation without apoptosis and enhanced the G1 phase pathways [38]. This unexpected conversion to normal liver tissues implies therapeutic potential against well-differentiated and poorly differentiated hepatomas.
Similarly, the regulation of malignancy by miR-520d-5p in other cancers appears not to be caused by a loss of metastatic properties but by the conversion of cancer cells to normal stem cells through a dedifferentiation process and the maintenance of upregulated p53 levels; this has not been observed previously in hiPSCs (Figure 4) [39]. Differences between the normal liver tissues and benign teratomas (dermoid cysts) might depend on the cellular miR-520d-5p or p53 expression levels. In vivo, the upregulation of Oct4, p53 and RGM249 and the downregulation of c-Myc, hTERT and Alb expression were characteristic genetic changes. The PROM1 expression levels did not change significantly [40], but the downregulation of CD44 [41]34 and upregulation of CD90, CD105 and CD13, which are mesenchymal stem cell markers, were significant at the transcriptional level (P < 0.01) [42].
The optimal conditions for the induction of each phenotype from HLF in vivo remain undetermined, although these inductions are assumed to be associated with reprogramming states or the homogeneity of the cellular states [43,44]. In the in vivo study, infection of HLF cells with a sufficient lentiviral titer induced the generation of homogeneous benign or normal tissues, whereas HLF cells infected with virus at an insufficient titer induced the generation of heterogeneous tissues that comprised two populations (normal liver tissue and mature teratoma); we therefore concluded that lentiviral integration did not promote the differentiation of transfectantsinto diverse phenotypes and that sufficient transfection efficiencies would reproducibly induce the transition of malignant cells to benign or normal states. In vitro, 520d-HLF differentiated into osteoblasts [45], suggesting differentiation into mesodermal tissue. Additionally, these cells demonstrated differentiation into endodermal (liver tissue) and ectodermal (epidermis) tissues in vivo, indicating that 520d-HLF the homogeneously converted to hPSCs, not CSCs. Surprisingly, undifferentiated cancer cells with strong metastatic and chemotherapy-resistant properties also converted to normal liver tissues. In a preliminary study of other types of undifferentiated malignant cells (glioblastomamultiforme, anaplastic thyroid cancer, pancreatic cancer and fibrosarcoma cells), we confirmed no tumor formation, the loss of malignant properties and ductal cell carcinoma conversion to pancreatic acinar cells or lipid-producing cells despite a presumably similar mechanism as that involved in the miR-520d-5p-induced conversion of HLF (data not yet available). These malignancies might be treated easily with miR-520d-5p, although they are known clinically to be extremely intractable malignancies. miR-520d-5p induction might be more sensitive in CSC because undifferentiated malignancies should contain CSCs.
Although Nanog or Oct4 can bind to the DNMT1 promoter region to drive transcriptional upregulation [46], DNMT1 expression was downregulated during this conversion in the current study. Methylation or demethylation might not be crucial events in the maintenance of pluripotency or the upregulation of p53. Although AID upregulation induces p53 mutations in somatic cells, leading to p53 downregulation and subsequent carcinogenesis [47], AID downregulation might play a part in p53 upregulation; however, the mechanism of p53 upregulation remains unclear. Unlike miR-520d-5p, siAID alone was not able to induce a phenotypic change. Gene-specific hypermethylation might silence developmentally related genes, leading to dedifferentiation [48]. The measurement of 5-hydroxymethyl-cytosine (5-hmC) revealed a more hypomethylated status in 7D, R1 and R2and slight hypermethylation in 5D (Figure. 4) [49]. Therefore, we propose a mechanism for how this miRNA induces the upregulation of both Nanog and Oct4 in normal cells and cancer cells, as shown in Figure 6.
In a previous report, a comparative metabolomic analysis of ESCs and iPSCs revealed similar differences in the levels of metabolites that are involved in transmethylation, cellular respiration and energy production; however, the S adenosylmethionine (SAM) cycle includes 5’-methylthioadenosine, hypoxanthine and inosine, which drive the methylation process, and all of these were significantly elevated in iPSCs compared with ESCs. Additionally, adenosyl methionine decarboxylase (AMD1) plays a crucial role in the renewal of normal stem cell pluripotency [50]. The methyl group belonging to SAM is the most common substrate in transmethylation reactions such as DNA methylation [15]. Additionally, the fatty acid (ω-3 and ω-6) levels were elevated in ESCs. In other words, the unsaturated fatty lipid levels were lower in iPSCs than in ESCs. In somatic cells, the oxidative:glycolytic energy production ratios were close to those in iPSCs. However, the oxidative:glycolytic energy production ratios in 520d-transfectants were lower than those in iPSCs. According to a comparative metabolic analysis of laser-dissected normal tissues and colon or gastric cancer tissues, the TCA cycle metabolites were not significantly elevated in the normal tissues [51]. Additionally, increased levels of citric acids in the TCA cycle lead to the suppression of glycolysis, but the citric acid levels were not found to be significantly increased in this study, suggesting that glycolysis was occurring. Thus, comparative metabolic profiling of the transfectants with malignant properties and with normal or benign properties showed that glycolysis, the urea cycle and amino acid synthesis were promoted, indicating the possibility that HLF cells might be converted to cells with stemness and immature somatic properties because the profile results were compatible with those of previous reports. Given that the bioenergetics of various somatic cells correlated with their reprogramming efficiencies [15], these findings might be applicable to cancer cells derived from somatic cells; more immature hepatomas might revert more easily to normal pluripotent cells with somatic properties because more immature cancers have higher bioenergetic levels. However, changes in the activities of different pathways such as glycolysis, nucleotide synthesis and the urea cycle cannot be ascertained from differences in the total metabolite statuses between different cell types alone, and therefore the use of stable isotope tracers, coupled with metabolomics analysis, must be conducted to warrant conclusions on metabolic pathway activity in future studies. This is because a given metabolite, such as lactate or ATP, can be synthesized from or consumed by a number of different pathways. Without isotope tracing, it would not be possible to confirm that lactate accumulation comes from glycolysis or that ATP buildup results from de novo nucleotide synthesis. Moreover, the majority of lactate produced during glycolysis is expected to be released into the medium, which was not analyzed in this report; also, the total ATP level is most likely sustained by oxidative or substrate-level phosphorylation (not measured in this report). Therefore, the present data only showed a tendency with regard to the difference between the malignant properties and benign properties of 520d-HLF cells. However, theremight be a meaningful relationship between the overallreduced metabolism in 5D cells and the progression of demethylation (Figure 3,4).
ELAVL2 (HuB) might be a target gene of miR-520d-5p. ELAVL2 is predicted to contain ten binding sites for miR-520d-5p (Supplementary Figure S5) in its 3’UTR sequence (1356-3805), suggesting that miR-520d-5p and siELAVL2 might bind at least two sites in the 3’UTR. ELAVL2 might play a crucial role in carcinogenesis or cancer stemness because transfectants (by miR-520d-5p or siELAVL2) that were cultured in ReproStem for more than two weeks did not generate tumors. The upregulation of p53, as well as Oct4 and Nanog, was induced by miR-520d-5p and siELAVL2 in an AID- or DNMT1-independent manner. Additionally, a month was required (four times at 1.0 x 10⁶ copies/week) to convert well-differentiated hepatoma cells (Huh7) to non-tumor forming cells, suggesting that miR-520d-5p might drive transfectants strongly toward dedifferentiation. Additionally, 520d-5p overexpression in fibroblasts (both NHDF-Ad and Neo) did not induce the formation of spheroid pluripotent cells in vitro or promote the acquisition of tumorigenicity in these cells (n = 6 for each; Supplementary Figure S6D).
In conclusion, herein, we did not elucidate the target gene of miR-520d-5p. However, we report a noteworthy function of hsa-miR-520d-5p and describe presumably key roles for p53, AID, Nanog and the miR-520d-5p target genes, including ELAVL2, TEAD1, SBF2, PUM2, GATAD2B and SEH1L, in the benign conversion process (Figure 5), in which well-differentiated and undifferentiated hepatoma cells were converted to normal/benign phenotypes via stemness induction, resulting in a reversal of malignancy in vivo. At present, we cannot explain these phenomena with regard to gene expression and metabolite production. Hence, this report contains speculations derived from raw data. Although the notion that cancerous cells cannot revert to their original, healthy, states is widely accepted, this idea might no longer be valid.
AUTHORS’ SUMMARY
miR-520d-5p can induce the transformation of hepatoma cells into non-malignant cells (hiPSC-like cells) while maintaining p53, Oct3/4 and NANOG upregulation via a stemness-mediated process; this was confirmed in vitro and in a xenograft model with 520d-5p-transfectants. Essentially, this mechanism might induce de-differentiation and DNA demethylation. Cancer cells that are more undifferentiated, including some cancer stem cells, are easier to convert to benign cells or normal cells than are more differentiated cancer cells. This might be the first evidence of loss of malignancy mediated by a single miRNA. Although the notion that cancerous cells cannot revert to their original, healthy, state is widely accepted, this supposition might no longer be valid.
ACKNOWLEDGMENTS
This work was supported by a Grant-in-Aid of Research for Promoting Technological Seeds B (development type), the Takeda Science Foundation, the Princess Takamatsu Cancer Research Fund,the Adaptable and Seamless Technology Transfer Program through Target-driven R&D (Exploratory Research) of the Japan Science and Technology Agency (JST)and a JSPS KAKENHI Grant (Grant-in-Aid for Challenging Exploratory Research) Number 23659285; none of these sources present a conflict of interest. The cell lines used in this study were provided by the Cell Resource Center for Biomedical Research, Institute of Development, Aging and Cancer, Tohoku University, Japan, and the American Type Culture Collection (ATCC). All PCR primers were designed by the INTEC Web and Genome Informatics Corporation (Tokyo, Japan). We thank Dr. Satoshi Kuwamoto regarding the pathological examination of xenografted tumor cells.
AUTHOR CONTRIBUTIONS
The author(s) have made the following declarations regarding their contributions: NM conceived and designed the experiments. ST, XW, KM performed the experiments. ST, KS, YM and NM analyzed the data. ST, KM and XW contributed reagents/materials/analytical tools. ST, JH, YM, KM, and NM wrote the manuscript.
ADDITIONAL INFORMATION REGARDING COMPETING FINANCIAL INTERESTS
The authors declare no competing financial interests.
REFERENCES
- Lee Y, Jeon K, Lee JT, Kim S, Kim VN. (2002). MicroRNA maturation: stepwise processing and subcellular localization. EMBO J. 21:4663-4670.
- Zeng Y, Cullen B.R. (2003). Sequence requirements for micro RNA processing and function in human cells. RNA. 9:112-123.
- Farazi TA, Spitzer JI, Morozov P, Tuschl TX. (2011). miRNA in human cancer. J. Pathol. 223:102-15.
- Guo H, Ingolia NT, Weissman JS, Bartel DP. (2010). Mammalian microRNAs predominantly act to decrease target mRNA levels. Nature. 466:835-840.
- Lee YS, Dutta A. (2006). MicroRNAs: small but potent oncogenes or tumor suppressors. Curr Opin Investig Drugs. 7:560-564.
- Lai EC. (2002). Micro RNAs are complementary to 3' UTR sequence motifs that mediate negative post-transcriptional regulation. Nat Genet. 30:363-364.
- Saetrom O, Snove OJr, Saetrom P. (2005). Weighted sequence motifs as an improved seeding step in microRNA target prediction lgorithms. RNA. 11:995-1003.
- Meltzer PS. (2005). Cancer genomics: small RNAs with big impacts. Nature. 435:745-746.
- Calin GA, Liu CG, Sevignani C, Ferracin M, Felli N, et al. (2004). MicroRNA profiling reveals distinct signatures in B cell chronic lymphocytic leukemias. Proc Natl Acad Sci USA. 101:11755–11760.
- Lu J, Getz G, Miska EA, Alvarez-Saavedra E, Lamb J, et al. (2005). MicroRNA expression profiles classify human cancers. Nature. 435:834–838.
- Li Z, Yang CS, Nakashima K, Rana TM. (2011). Small RNA-mediated regulation of iPS cell generation. EMBO J. 30:823-834.
- Lin SL, Chang DC, Chang-Lin S, Lin CH, Wu DTS, et al. (2008). Mir-302 reprograms human skin cancer cells into a pluripotent ES-cell-like state. RNA. 14:2115-2124.
- Lowery AJ, Miller N, Devaney A, McNeill RE, Davoren PA, et al. (2009). MicroRNA signatures predict oestrogen receptor, progesterone receptor and HER2/neu receptor status in breast cancer. Breast Cancer Res. 11:R27.
- Miura N, Sato R, Tsukamoto T, Shimizu M, Kabashima H, et al. (2009). A noncoding RNA gene on chromosome 10p15.3 may function upstream of hTERT. BMC Mol Biol. 2:10(5).
- Panopoulos AD, Yanes O, Ruiz S, Kida YS, Diep D, et al. (2012). The metabolome of induced pluripotent stem cells reveals metabolic changes occurring in somatic cell reprogramming. Cell Res. 22:168-177.
- Nakagawa M, Koyanagi M, Tanabe K, Takahashi K, Ichisaka T, et al. (2008). Generation of induced pluripotent stem cells without Myc from mouse and human fibroblasts. Nat Biotechnol. 26:101-106.
- Takahashi K, Tanabe K, Ohnuki M, Narita M, Ichisaka T, et al. (2007). Induction of pluripotent stem cells from adult human fibroblasts by defined factors. Cell. 131:861-872.
- Miura, N.et al. Clinical usefulness of serum telomerase reverse transcriptase (hTERT) mRNA and epidermal growth factor receptor (EGFR) mRNA as a novel tumor marker for lung cancer. Cancer Sci.97, 1366-1373(2006).
- Shomori, K.et al. Thymidine phosphorylase expression in human colorectal mucosa, adenoma and carcinoma: role of p53 expression. Pathol.Int. 49,491–499(1999).
- Ohashi, Y.et al. Depiction of metabolome changes in histidine-starved Escherichia coli by CE-TOFMS. Mol. Biosyst.4, 135-147(2008).
- Baran, R.et al. MathDAMP: a package for differential analysis of metabolite profiles.BMC Bioinformatics13, 7: 530(2006).
- Klukas, C.&Schreiber, F. Integration of -omics data and networks for biomedical research with VANTED. J.Integr.Bioinform.2,7:112(2010).
- Ghildiyal, M.&Zamore, P.D. Small silencing RNAs: an expanding universe. Nat. Rev. Genet.10,94-108(2009).
- Ladeiro, Y.et al. MicroRNA profiling in hepatocellular tumors is associated with clinical features and oncogene/tumor suppressor gene mutations. Hepatology47,1955-1963(2008).
- Farazi, T.A., Hoell, J.I., Morozov, P.&Tuschl, T.MicroRNAs in human cancer.Adv. Exp. Med. Biol.774,1-20(2013).
- He, L.et al. AmicroRNA polycistron as a potential human oncogene.Nature435,828-833(2005).
- Goodarzi, H., Elemento, O.&Tavazoie, S. Revealing global regulatory perturbations across human cancers. Mol. Cell 36,900-911(2009).
- Okita, K., Ichisaka, T.&Yamanaka, S. Generation of germline-competent induced pluripotent stem cells. Nature448, 313-317(2007).
- Fujioka, T. et al. Establishment of induced pluripotent stem cells from human neonatal tissues. Hum.Cell23, 113-118(2010).
- Yehezkel, S.et al. Reprogramming of telomeric regions during the generation of human induced pluripotent stem cells and subsequent differentiation into fibroblast-like derivatives. Epigenetics21, 6(2010).
- Bhutani, N.et al. Reprogramming towards pluripotency requires AID-dependent DNA demethylation. Nature463, 1042-1047(2010).
- De Carvalho, D.D., You, J.S.&Jones, P.A. DNA methylation and cellular reprogramming. Trends Cell Biol.20, 609-617(2010).
- Saito, Y.et al. Increased protein expression of DNA methyltransferase (DNMT) 1 is significantly correlated with the malignant potential and poor prognosis of human hepatocellular carcinomas. Int. J. Cancer105, 527-532(2003).
- Tatemichi, M., Hata, H.&Nakadate, T. Ectopic expression of activation-induced cytidinedeaminase caused by epigenetics modification. Oncol.Rep.25, 153-158(2011).
- Gunaratne, P.H.Embryonic stem cell microRNAs: defining factors in induced pluripotent (iPS) and cancer (CSC) stem cells?Curr. Stem Cell Res.Ther.4,168-177(2009).
- Sen, G.L.et al.DNMT1 maintains progenitor function in self-renewing somatic tissue.Nature463,563-567(2010).
- Nascimento, E.M., Cox, C.L., MacArthur, S., Hussain, S., Trotter, M., et al. The opposing transcriptional functions of Sin3a and c-Myc are required to maintain tissue homeostasis.Nat. Cell Biol.13,1395-1405(2011).
- Lin, S.L.et al. Regulation of somatic cell reprogramming through inducible mir-302 expression. Nucleic Acids Res.39, 1054-1065(2010).
- 32. Kawamura, T.et al. Linking the p53tumour suppressor pathway to somatic cell reprogramming.Nature460, 1140-1144(2009).
- Zhu, Z.et al. Cancer stem/progenitor cells are highly enriched in CD133+CD44+ population in hepatocellular carcinoma. Int. J. Cancer126, 2067-2078(2010).
- Henry, J.C.et al. miR-199a-3p targets CD44 and reduces proliferation of CD44 positive hepatocellular carcinoma cell lines. Biochem.Biophys. Res. Commun.403, 120-125(2010).
- Liu, T.et al. High efficiency of reprogramming CD34⁺ cells derived from human amniotic fluid into induced pluripotent stem cells with Oct4.Stem Cells Dev.21, 2322-2332(2012).
- 36. Sand, M.et al. Expression levels of the microRNA processing enzymes Drosha and dicer in epithelial skin cancer. Cancer Invest.28, 649-653(2010).
- Chen, M., et al. Serum starvation induced cell cycle synchronization facilitates human somatic cells reprogramming. PLoS One7, e28203(2012).
- Plaisant, M.et al. Activation of hedgehog signaling inhibits osteoblast differentiation of human mesenchymal stem cells. Stem Cells27, 703-713(2009).
- Tsai, C.C.et al. Oct4 and Nanog directly regulate Dnmt1 to maintain self-renewal and undifferentiated state in mesenchymal stem cells. Molecular Cell 47, 169-182(2012).
- Takai, A.et al. A novel mouse model of hepatocarcinogenesis triggered by AID causing deleterious p53 mutations.Oncogene28, 1469-1478(2009).
- Han, J., Sachdev, P.S.&Sidhu, K.S. A combined epigenetic and non-genetic approach for reprogramming human somatic cells.PLoS One5, e12297(2010).
- Mitchell, N.E.et al.Real-time methylomic aberrations during initiation and progression of induced human mammary epithelial cell tumorigenesis.Epigenomics5,155-165(2013).
- Zhang, D.et al. AMD1 is essential for ESC self-renewal and is translationally down-regulated on differentiation to neural precursor cells. Genes Dev.26,461-473(2012).
- Hirayama, A.et al. Quantitative metabolome profiling of colon and stomach cancer microenvironment by capillary electrophoresis time-of-flight mass spectrometry.Cancer Res.69,4918-4925(2009).
Copyright: Miura N, et al. ©2020. This is an open-access article distributed under the terms of the Creative Commons Attribution License, which permits unrestricted use, distribution, and reproduction in any medium, provided the original author and source are credited.
Citation: Miura N (2020). Conversion of Human Hepatoma Cells by 520d-5p to Benign or Normal Liver Tissues via a stemness Mediated Process. Oncogen 3(1): 22.